Answer the question
In order to leave comments, you need to log in
How to hide intermediate units of measurements along the axes in plotly?
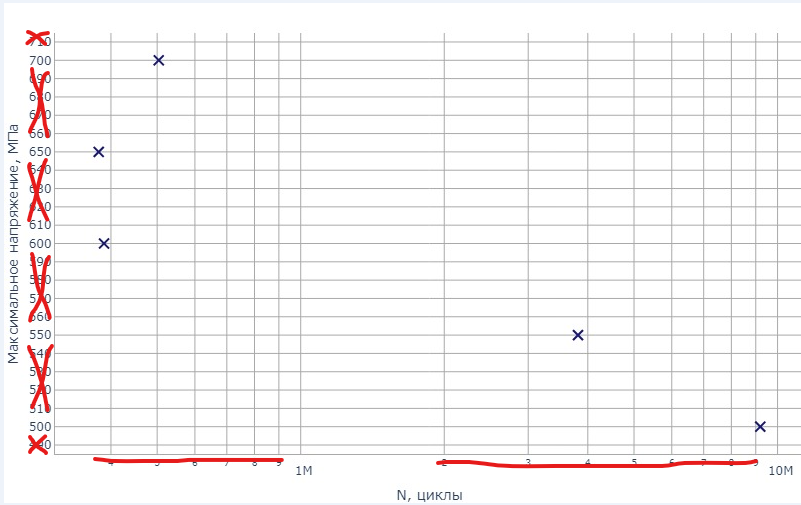
Hello. Can anyone tell me how to remove intermediate labels on the logarithmic horizontal axis of a graph built in plotly using plotly.graph_objects , leaving only the main ones (see photo). The lines should remain. How to make 1,000,000 and 10,000,000 instead of 1M and 10M? The same goes for the vertical axis. I'm using the Scatter object.
Answer the question
In order to leave comments, you need to log in
on the vertical axis in your case should help
fig.update_yaxes(tickvals=[500, 550, 600, 650, 700])Didn't find what you were looking for?
Ask your questionAsk a Question
731 491 924 answers to any question