Answer the question
In order to leave comments, you need to log in
How to graph a function in PascalABC?
uses GraphABC;
begin
SetWindowSize(500, 500);
var x, y, dt, t, a,l: Real;
write('a=');
read(a);
write('l=');
read(l);
dt := 0.001;
t:= pi/2;
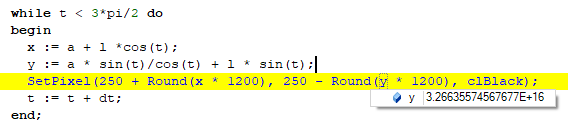
while t < 3*pi/2 do
begin
x := a + l *cos(t);
y := a * sin(t)/cos(t) + l * sin(t);
SetPixel(250 + Round(x * 1200), 250 - Round(y * 1200), clBlack);
t := t + dt;
end;
end.Answer the question
In order to leave comments, you need to log in
Didn't find what you were looking for?
Ask your questionAsk a Question
731 491 924 answers to any question