Answer the question
In order to leave comments, you need to log in
How to get the most out of a Google Breakpad dump?
For example,
- took the open project QOwnNotes.
- connected breakpad
- created an error 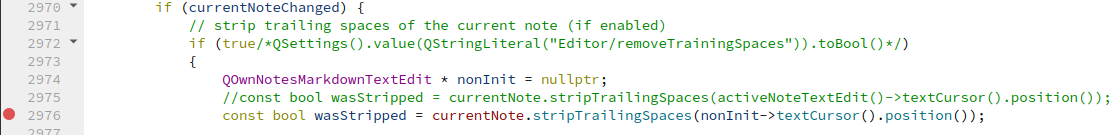
- the application crashed, the dump was saved. I set minidump_stackwalk and minidump_dump on it. The result is text files of the result of the work.
In principle, reading the _stack.txt file, you can understand what's going on:
Thread 0 (crashed)
 0  libQt5Widgets.so.5 + 0x308061
    rax = 0x00007ffe03827cf0   rdx = 0x0000000000000000
    rcx = 0x0000000003707e93   rbx = 0x00007ffe03828540
    rsi = 0x0000000000000000   rdi = 0x00007ffe03827cf0
    rbp = 0x00007ffe03827d30   rsp = 0x00007ffe03827c70
     r8 = 0x0000000000000053    r9 = 0x0000000000000000
    r10 = 0x2ce33e6c02ce33e7   r11 = 0x00007ffe03827880
    r12 = 0x000055948b476a90   r13 = 0x0000559489e408a0
    r14 = 0x000055948b471000   r15 = 0x00007ffe03827f10
    rip = 0x00007f7524f3f061
    Found by: given as instruction pointer in context
 1  QOwnNotes!QtPrivate::FunctorCall<QtPrivate::IndexesList<>, QtPrivate::List<>, void, void (MainWindow::*)()>::call(void (MainWindow::*)(), MainWindow*, void**) [qobjectdefs_impl.h : 152 + 0x5]
    rbp = 0x00007ffe03827d70   rsp = 0x00007ffe03827d40
    rip = 0x000055948758caad
    Found by: previous frame's frame pointer
 2  QOwnNotes!void QtPrivate::FunctionPointer<void (MainWindow::*)()>::call<QtPrivate::List<>, void>(void (MainWindow::*)(), MainWindow*, void**) [qobjectdefs_impl.h : 185 + 0x1b]
    rbp = 0x00007ffe03827da0   rsp = 0x00007ffe03827d80
    rip = 0x000055948758b253
    Found by: call frame info
 3  QOwnNotes!QtPrivate::QSlotObject<void (MainWindow::*)(), QtPrivate::List<>, void>::impl(int, QtPrivate::QSlotObjectBase*, QObject*, void**, bool*) [qobjectdefs_impl.h : 414 + 0x1f]
    rbp = 0x00007ffe03827df0   rsp = 0x00007ffe03827db0
    rip = 0x0000559487587d33
    Found by: call frame info
 4  libQt5Core.so.5 + 0x2aea36
    rbx = 0x00007ffe038284f0   rbp = 0x00007ffe03827f00
    rsp = 0x00007ffe03827e00   rip = 0x00007f752260ca36
    Found by: call frame info
 5  libQt5Core.so.5 + 0x2bb1d7
    rbp = 0x00007ffe03827fb0   rsp = 0x00007ffe03827f10
    rip = 0x00007f75226191d7
    Found by: previous frame's frame pointer
 6  libQt5Widgets.so.5 + 0x160f6c
    rbp = 0x00007ffe038281d0   rsp = 0x00007ffe03827fc0
    rip = 0x00007f7524d97f6c
    Found by: previous frame's frame pointer
 7  libQt5Widgets.so.5 + 0x168120
    rbp = 0x00007ffe038281d0   rsp = 0x00007ffe03827ff0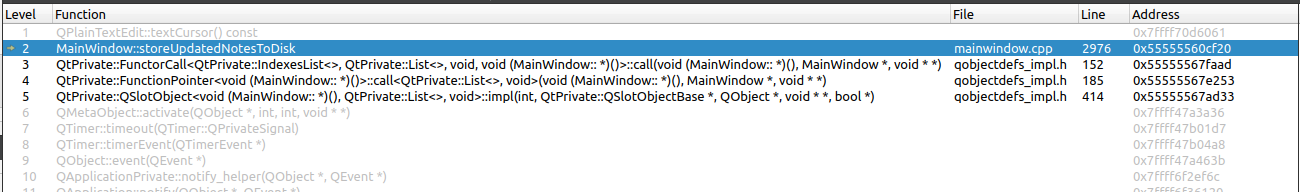
Answer the question
In order to leave comments, you need to log in
Didn't find what you were looking for?
Ask your questionAsk a Question
731 491 924 answers to any question