Answer the question
In order to leave comments, you need to log in
How to generate numbers in a given range and with the desired distribution?
Hello, there is a task to generate a set of numbers in a given range and in which the values will be distributed around the given points.
For example, you want to generate numbers in the range -10 to 100 based on such a graph.
The function will be given the boundaries of the range and the points where you need the largest accumulation of numbers with a probability of being drawn. 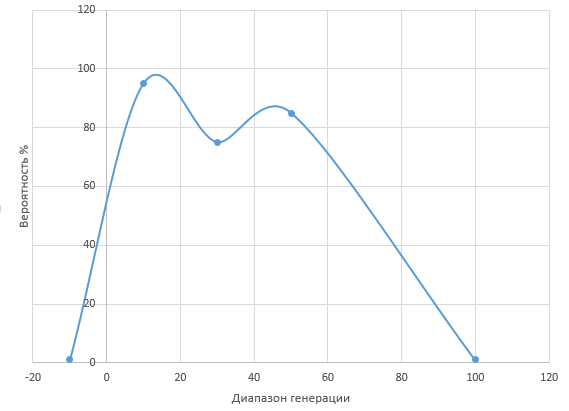
Specifically for this chart:
Generation limits -10, 100. Cluster points -10 with 1% probability, point 10 with 95% probability, point 30 with 75% probability, point 50 with 85% probability, point 100 with 1% probability.
And to make such points, for example, you would need 15. The result could be numbers: 5, 9, 10, 8, 22, 25, 26, 20, 48, 30, 32, 50, 62, 55, 75
Answer the question
In order to leave comments, you need to log in
Surely there are ready-made libraries. If you can't find it, use a uniform distribution. Then the wider the interval, the more likely it is to fall into it. Equate the area under your figure to one, and then divide it into intervals with the required accuracy. The area of each figure in the interval will be equal to the probability of falling into this interval, while the sum of the areas of all such figures should be 1. Then you can generate a number with a given law. In the example, I divided it into three intervals (for you there will be few of them for sure, I took three for simplicity). We generate a number using a uniform distribution in the range from 0 to 1, then if the result is a number in the range (0..0.33), we are in the first interval. If it turned out in the range of 0.33..(0.33+0.2), we ended up in the second interval, while 0.53..1 is the third one.
P.s. The sum of the probabilities cannot be greater than 100%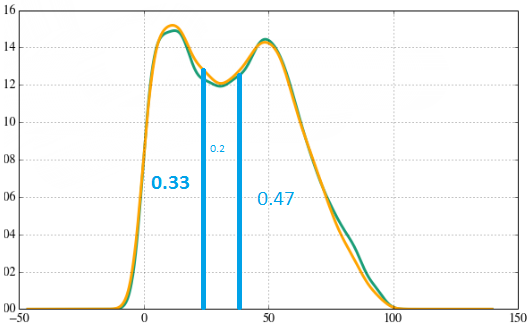
Here on the face of the distribution of weights.
I did something similar in python:
wt - input array with weights, for example [60,30,10] or [60,30,10,5] - the sum does not have to be equal to 100 or some other value. All this is taken into account.
The task is to give an index in the wt array with a probability proportional to the weight in this position.
from random import random
wt = [60,30,10]               # массив весов
cw = 0                        # тут будем накапливать веса
rv = random() * sum(wt)       # берем рандом от 0 до 1 и приводим к масштабу (сумма весов)
for j in range(len(wt)):      # проходим по всем весам
  cw += wt[j]                 # прибавляем к аккумулятору вес
      if cw > rv:             # проверяем не превысил ли накопленный вес случайное значение?
        break                 # если превысил, значит в диапазон этого веса мы и попали.
print(j) # печатаем найденный индексDraw a rectangle from (-10; 100) to (100; 0) that includes the given curve.
Using the Monte Carlo method, we throw points there.
We check the Y coordinate.
Above the given graph, we ignore it.
Below, we read the X coordinate.
Repeat until we have the required number of points.
Didn't find what you were looking for?
Ask your questionAsk a Question
731 491 924 answers to any question