Answer the question
In order to leave comments, you need to log in
How to find out which WordPress plugin loads the server at 100%?
We have a server on Digitalocean. The site has WordPress with plugins. A few hours ago the site was dead, the server "fell down". On the HTOP command, we see that the percentage is 100% loaded. In HTOP, press F9, select what the server loads, that is, fail2ban, and press Enter. Fail2ban goes away, the site starts working a bit, but in HTOP it now actively loads the php-fpm server: pool www and everything freezes again, the site does not work. After a few minutes, fail2ban appears again. And so constantly.
I can't upload a screenshot of the server. The toaster site is not loading.
When the site was working, all plugins were quickly deactivated. The site continued to work, however, in HTOP, the percentage was under 100%, but the site worked and did not even freeze. As soon as we turned on several important plugins for the site: WP-Shop, TablePress and shortcodes, everything immediately broke down again.
What to do, tell me?
The programmer who administrated the servers disappeared, has not been in contact for a long time, although everything worked. But today it broke.
Our server level is Beginner. We know how to enter commands, we know how to use the terminal, but we don’t know the necessary commands (for example, how to quickly look at what the server is loading) and we don’t know how to diagnose problems. Maybe something should be clear in the logs? But in what logs to look and what to do with this knowledge is not clear.
You need an understanding of what to do, what to watch, what to turn off. To fix it ourselves.
I was able to upload screenshots. Sending:
Maybe someone will see something useful that will help solve the problem. Maybe some more logs are needed?
But I understand that DDOsyat. If this is true, then what to do about it?
Here are the /var/crash/_usr_bin_fail2ban-server.0/crash logs 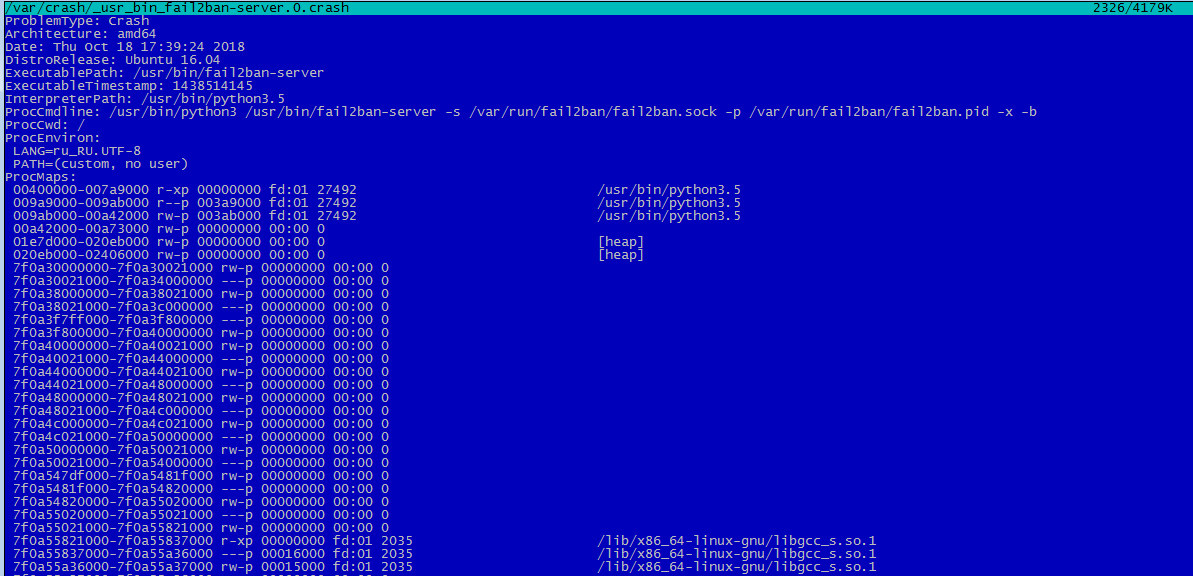
Here are the logs: var/log/nginx/error.log
Part 1: Part 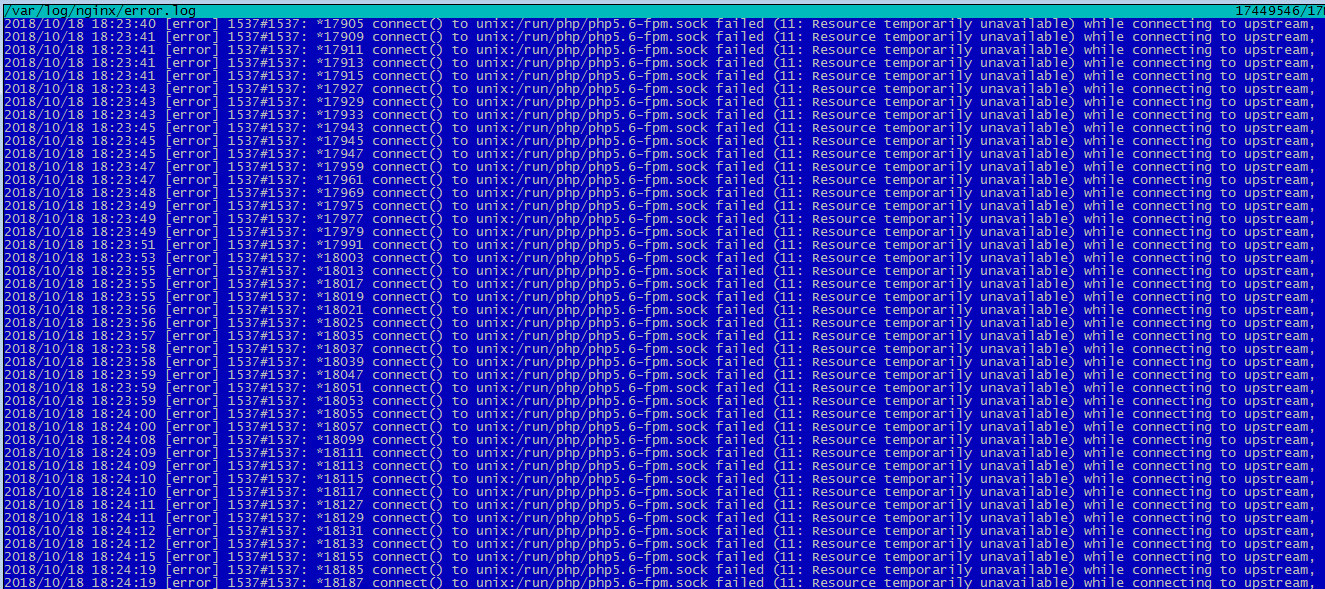
2: 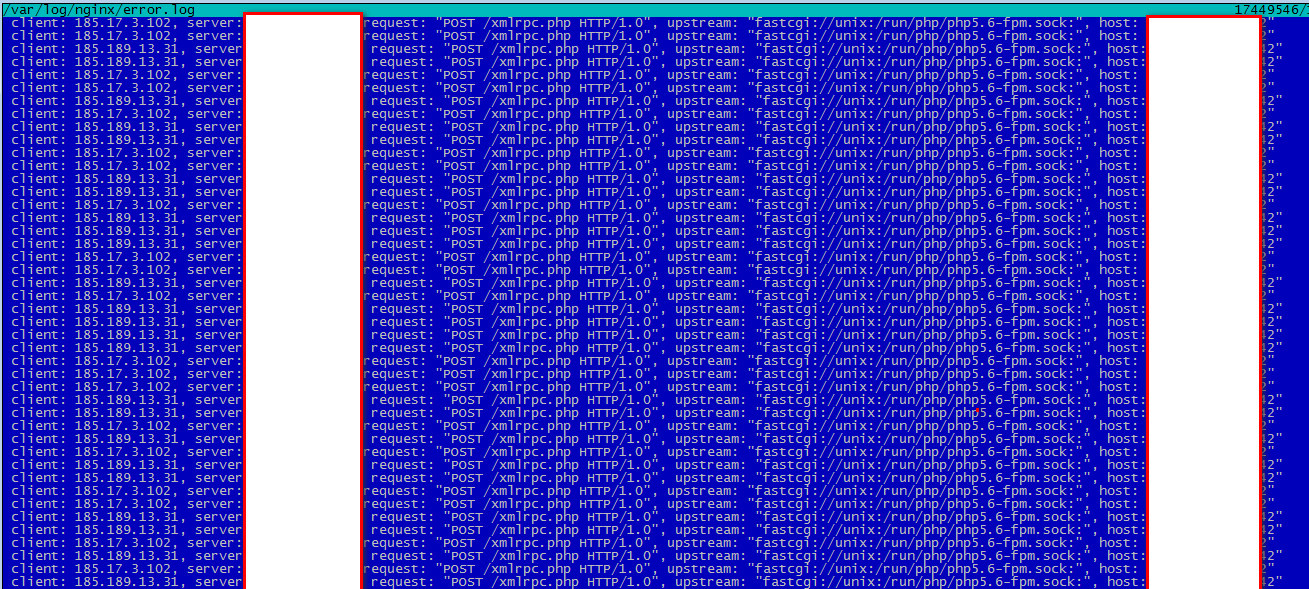
Here are the /var/log/fail2ban.log logs from when everything started. there is a lot of text in a short period of time. I took a screenshot of a few moments, the beginning and the stack:
1 part: 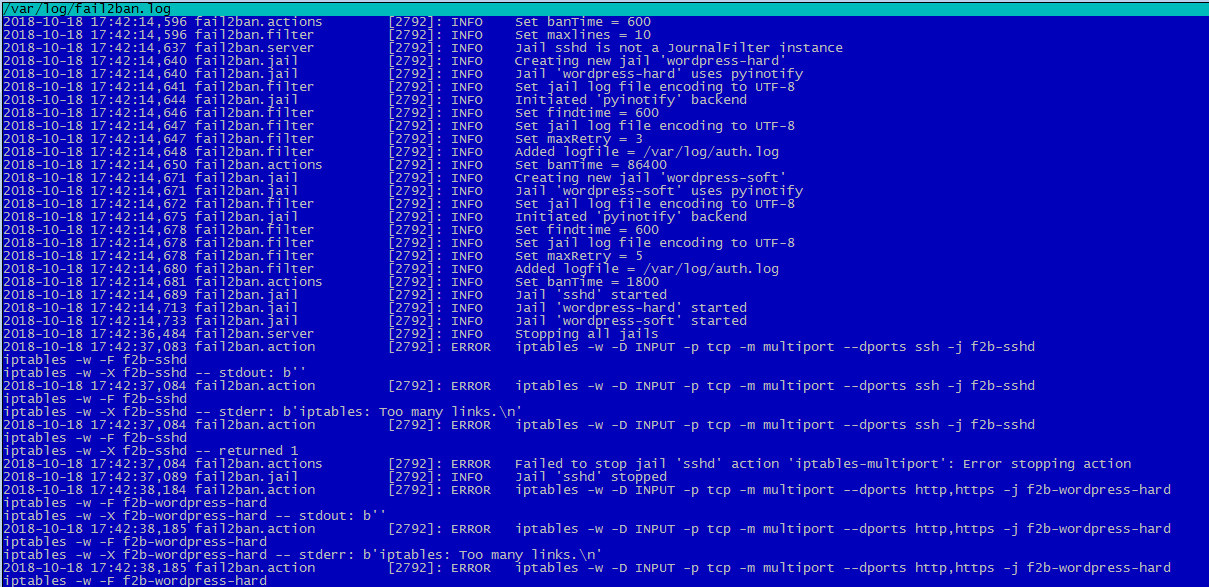
2 part: 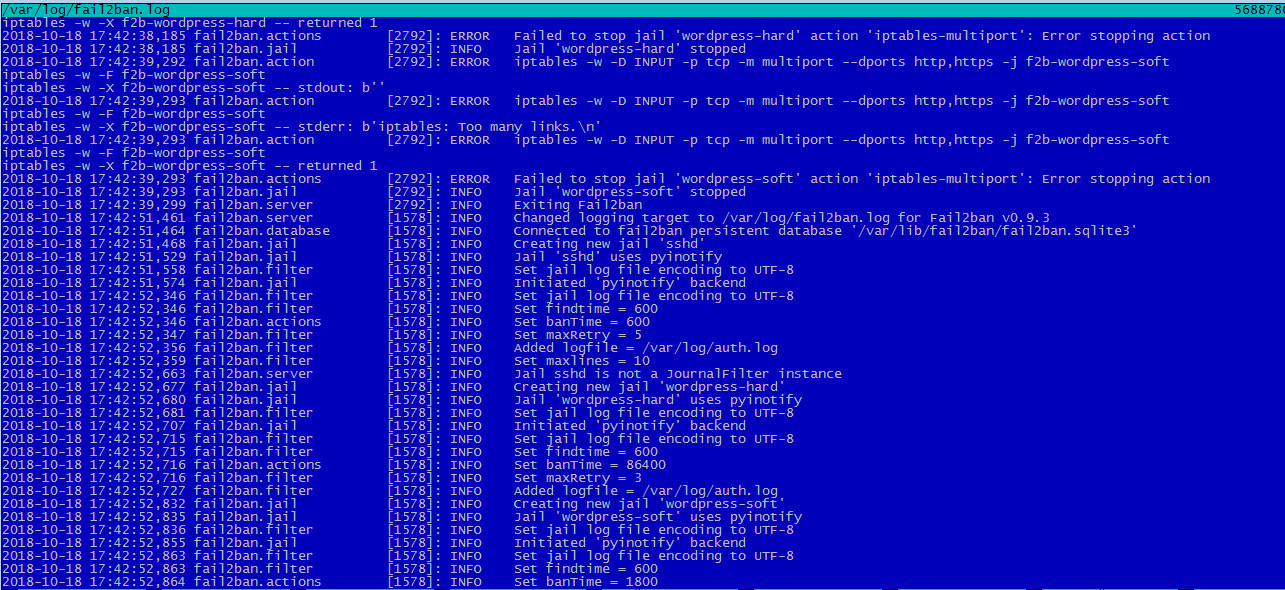
3 part: 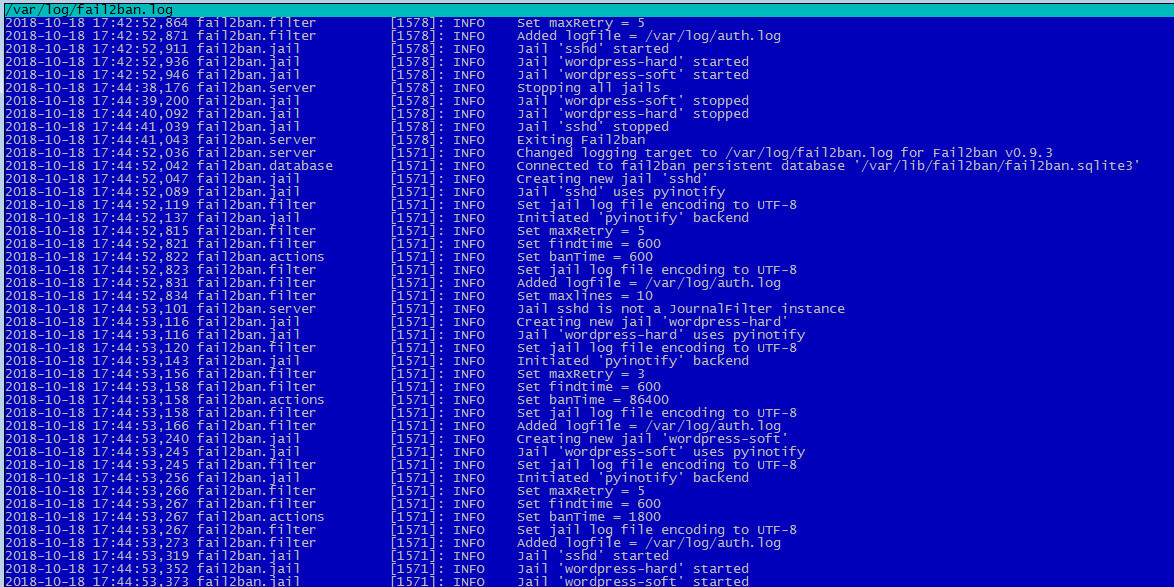
4 part: 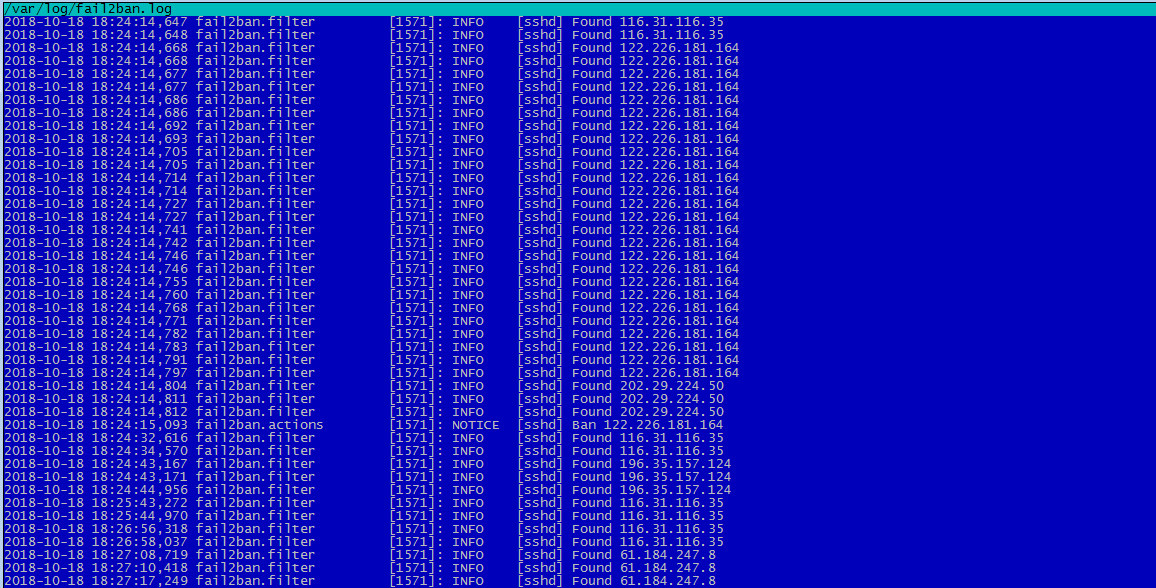
Now the server is loaded at 90%, usually under 20%. I wish I knew what to do ahead of time.
Answer the question
In order to leave comments, you need to log in
Can you be ddosed if fail2ban hangs?
Chopping it off, on the contrary, you pass all incoming connections to the server.
So it's not about plugins, I think.
Plugins separately you will not be able to find out automatically. The simplest thing is the web server logs, ladies should have information about the page loading time. Well, or look in the metric if you have it. If this does not help, look in the direction of the total who spends what. How much is the base, how much PHP, at what time. You will probably have to disable plugins after localizing a small list that falls under suspicion.
Better yet, find out what plugins were added before the problem was fixed
Didn't find what you were looking for?
Ask your questionAsk a Question
731 491 924 answers to any question