
Answer the question
In order to leave comments, you need to log in
How to extract coordinates from a graph image?
There are two types of charts. 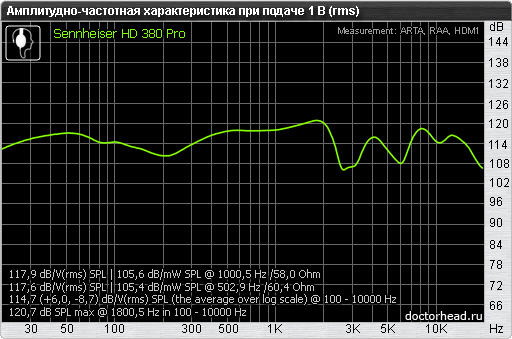
How to pull out the coordinates (of the form [x, y]), I have never done this, but the difficulties will not stop, because it is very necessary.
On what (in what) can it be most quickly implemented? What algorithm?
Answer the question
In order to leave comments, you need to log in
If it’s fast and on the knee, then:
1) we prepare images in a special way by removing unnecessary information:

and
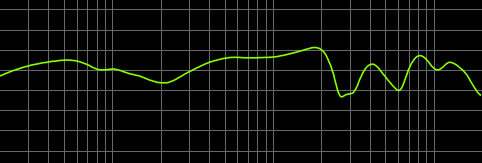
2) we get the values of the boundary lines of the grid, the colors of the grid and graphs for the prepared images:
x: 10 and 10000, y: -25 and 10, grid rgb(221,221,221), graph rgb(0,0,255)
for x: 30 and 10000, for y: 90 and 132, grid rgb(104,104,104), graph rgb(150,255,0)
3) in python using PIL we write code that will receive coordinates from the provided data:
# -*- coding: utf-8 -*-

from math import log10, fabs
import Image


def check_pixel_colour(pixel, colour, delta=(0,0,0)):
    '''сравниваем цвет пиксиля с эталонным цветом с погрешностью дельта'''
    return (colour[0] - delta[0]) <= pixel[0] <= (colour[0] + delta[0]) and\
           (colour[1] - delta[1]) <= pixel[1] <= (colour[1] + delta[1]) and\
           (colour[2] - delta[2]) <= pixel[2] <= (colour[2] + delta[2])


def better_colour_value(pixels, colour):
    '''из списка цветов выбираем более подходящий эталонному цвету'''
    delta = 1024
    better_pixel = None
    for pixel in pixels:
        current_delta = fabs(pixel[0] - colour[0]) +\
                        fabs(pixel[1] - colour[1]) +\
                        fabs(pixel[2] - colour[2])
        if current_delta < delta:
            delta = current_delta
            better_pixel = pixel
    return better_pixel


def get_border_grids(image, grid_colour):
    '''
    получаем номера пиксилей по оси x первой и последней линий сетки, по оси y верхней и нижней
    данные пиксили соответствуют переданным граничным значениям сетки
    '''
    width, height = image.size
    for x in xrange(width):
        if check_pixel_colour(image.getpixel((x, 0)), grid_colour):
            yield x
            break
    for x in xrange(width - 1, -1, -1):
        if check_pixel_colour(image.getpixel((x, 0)), grid_colour):
            yield x
            break
    for y in xrange(height - 1, -1, -1):
        if check_pixel_colour(image.getpixel((0, y)), grid_colour):
            yield y
            break
    for y in xrange(height):
        if check_pixel_colour(image.getpixel((0, y)), grid_colour):
            yield y
            break


def get_linear_value(x, x1, x2, x1_value, x2_value):
    '''получаем значение для текущего пикселя с учетом граничных значений сетки для линейной оси'''
    k = (x2 - x1) / (x2_value - x1_value)
    b = x1 - k * x1_value
    return (x - b) / k


def get_log_value(x, x1, x2, x1_value, x2_value):
    '''получаем значение для текущего пикселя с учетом граничных значений сетки для логорифмической оси'''
    k = (x1 - x2) / (log10(x1_value) - log10(x2_value))
    b = x1 - k * log10(x1_value)
    return 10**((x - b) / k)


def process_graph(image_path, x1_value, x2_value, y1_value, y2_value, colour, delta, grid_colour):
    '''получаем список координат графика на изображении'''
    image = Image.open(image_path)
    width, height = image.size
    x1, x2, y1, y2 = get_border_grids(image, grid_colour)
    coordinates = []

    for x in xrange(width):
        pixels = {}
        for y in xrange(height):
            pixel = image.getpixel((x, y))
            if check_pixel_colour(pixel, colour, delta):
                pixels[pixel] = y
        if len(pixels) > 0:
            y = pixels[better_colour_value(pixels.keys(), colour)]
            x_value = get_log_value(x, x1, x2, x1_value, x2_value)
            y_value = get_linear_value(height - y, height - y1, height - y2, y1_value, y2_value)
            coordinates.append((x_value, y_value))

    return coordinates


if __name__ == '__main__':
    print process_graph('test_001.png', 10., 10000., -25., 10., (0,0,255), (10,10,50), (221,221,221))
    print process_graph('test_002.png', 30., 10000., 90., 132., (150,255,0), (50,50,10), (104,104,104))
Some kind of strange wording of the problem ... What does it mean to pull out the coordinates? What are the coordinates? A graph is a graphical representation of a function, or an array of x,y pairs. Do you need to pull out the entire array? Or knowing x to get y?
1) determine in pixels the field where the graph is located
2) set the scale (how many pixels per unit of value)
3) go through the field and look for green or blue lines (pixels) and mark the coordinates in the array (you only need to go vertically, when searching points on the graph)
If the graph is in the program, then it will be much more accurate and reliable (but perhaps more difficult, and perhaps easier) to tear out the data directly from the program.
I used g3data once . The result was not very satisfying. But it's fine for simple graphs.
Didn't find what you were looking for?
Ask your questionAsk a Question
731 491 924 answers to any question