Answer the question
In order to leave comments, you need to log in
How to draw graphs and display them in a document?
Hello.
It is required to make a desktop application in WPF that does mathematical calculations, draws graphs and spit out a report according to a given template. There are no problems with the first and third ones.
The problem is only in drawing function graphs and how to push these graphs into a template (.docx, .pdf).
Are there any libraries, articles, built-in tools for .NET/WPF? It was much easier on the Web. I don't know how to do it.
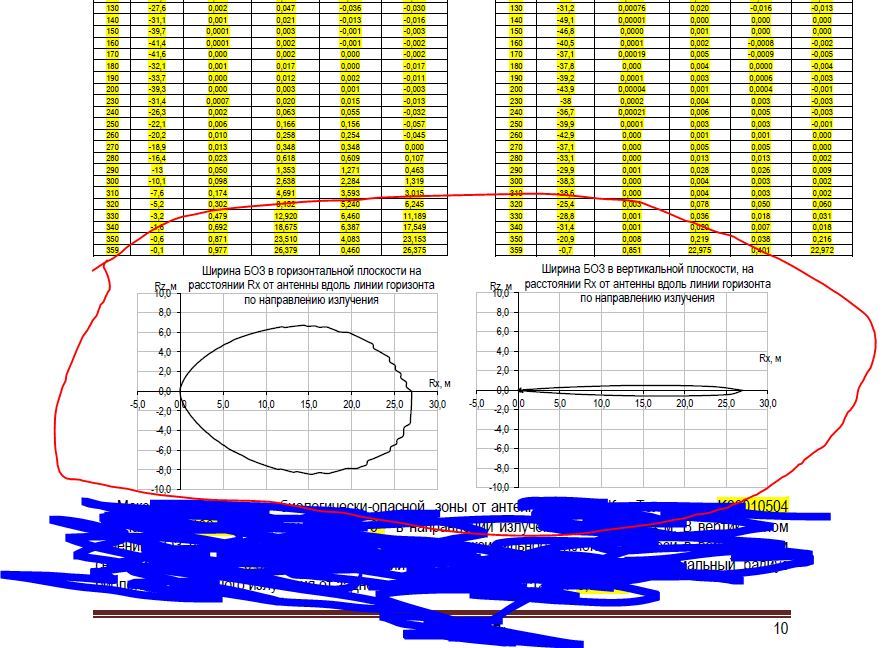
Example:
Answer the question
In order to leave comments, you need to log in
I made a coordinate grid on Canvas and draw whatever you want, then saving it as an image and putting it into a document is not a problem.
for Excel - epplus, for Word - DocX
You draw graphics with this thing . She can export both to .pdf and to a picture. To insert a picture into .docx, use this example.
Didn't find what you were looking for?
Ask your questionAsk a Question
731 491 924 answers to any question