Answer the question
In order to leave comments, you need to log in
How to draw a graph with time in OxyPlot of their database?
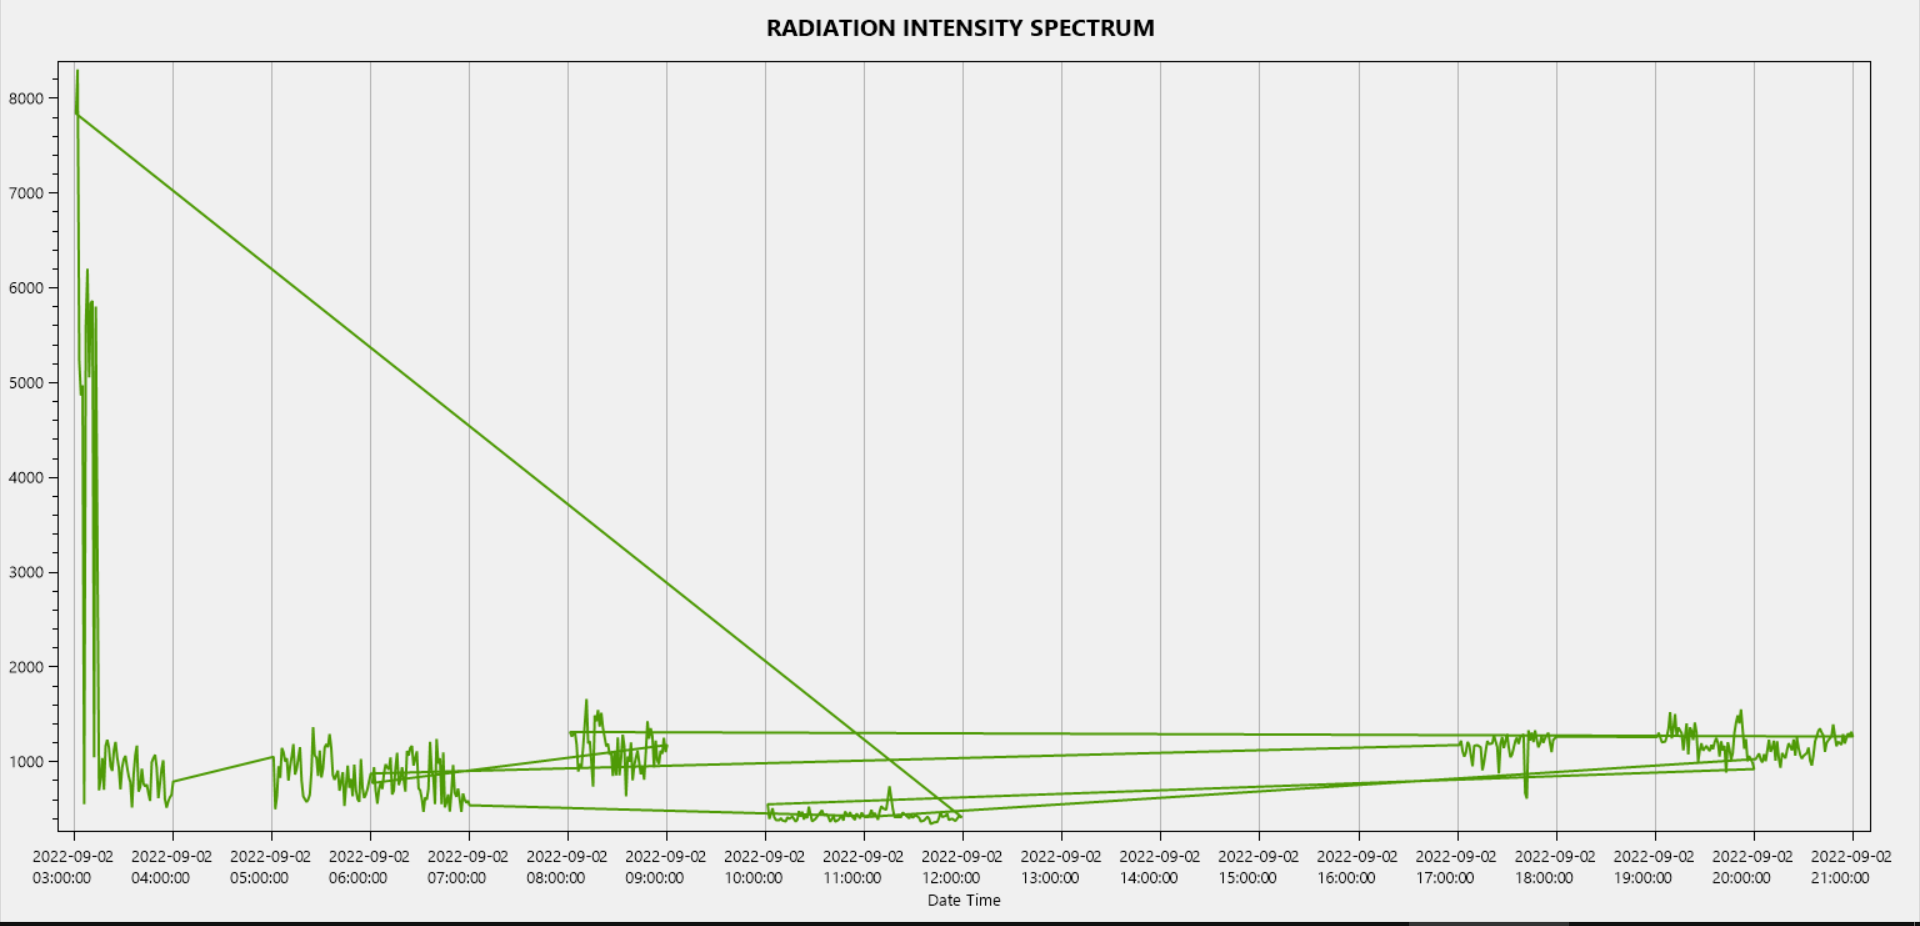
I am drawing a graph from MySQL database data, it gets data out of order for example: 2022.02.10 20:00 , and then 2022.02.10 10:00, and the graph is drawn crookedly:

valuesX = DB.SelectDouble(ref conn, "CX");
valuesY = DB.SelectDouble(ref conn, "CY");
valuesZ = DB.SelectDouble(ref conn, "CZ");
dates = DB.Select(ref conn, "Date time");

for (int i = 0; i < dates.Count; i++)
{
    lineX.Points.Add(new DataPoint(DateTimeAxis.ToDouble(Convert.ToDateTime(dates[i])), valuesX[i]));
}

model.Series.Add(lineX);
model.Series.Add(lineY);
model.Series.Add(lineZ);
model.Axes.Add(xAxis);
model.Axes.Add(new LinearAxis());


plotView1.Model = model;Answer the question
In order to leave comments, you need to log in
Well, sort the data by time. Or in a database query, or in an array.
It gets data out of order, for example: 2022.02.10 20:00 , and then 2022.02.10 10:00, and the graph is drawn crookedly:
Didn't find what you were looking for?
Ask your questionAsk a Question
731 491 924 answers to any question