Answer the question
In order to leave comments, you need to log in
How to draw a graph with hatching in c#?
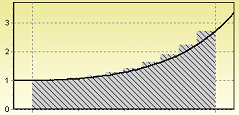
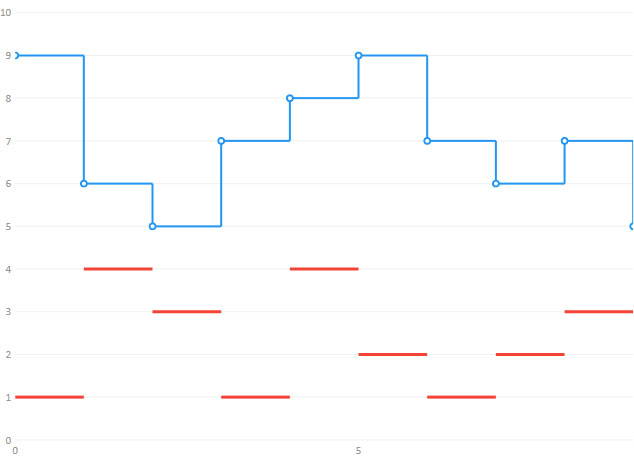
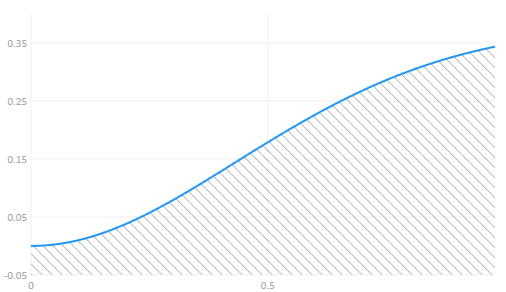
You need to make such a chart

. The principle is clear:
using livecharts, I immediately draw a step line, shade everything inside

and then draw a regular line on top
. But, the only problem is that I don’t know how to shade the first chart (step line) in livecharts.
Or would you recommend using another lib?
Probably there must be a ready-made hatching method somewhere.
Answer the question
In order to leave comments, you need to log in
I wrote something myself, looked at something on the Internet and got this:
public static Brush HatchBrush
        {
            get
            {
                var canvas = new Canvas();

                canvas.Children.Add(new Path
                {
                    Stroke = Brushes.Black,
                    StrokeThickness = 1,
                    Data = new LineGeometry(new Point(0, 0), new Point(40, 40))
                });

                var myHathBrush = new VisualBrush
                {
                    TileMode = TileMode.Tile,
                    Viewport = new Rect(0, 0, 10, 10),
                    ViewportUnits = BrushMappingMode.Absolute,
                    Visual = canvas
                };

                return myHathBrush;
            }
        }
Didn't find what you were looking for?
Ask your questionAsk a Question
731 491 924 answers to any question