Answer the question
In order to leave comments, you need to log in
How to display two graphs on fl_chart in one line chart and adjust their pattern according to the lows and highs?
i have two graphs
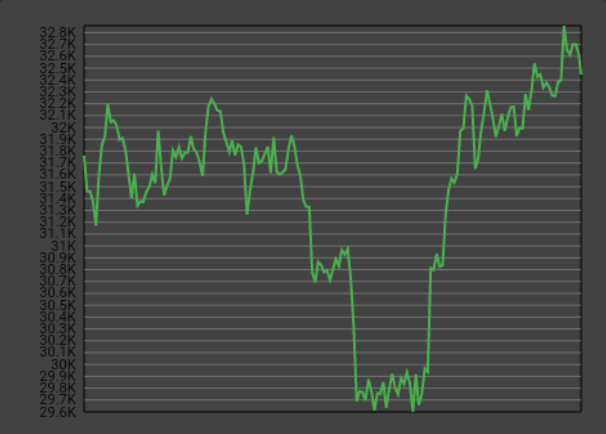
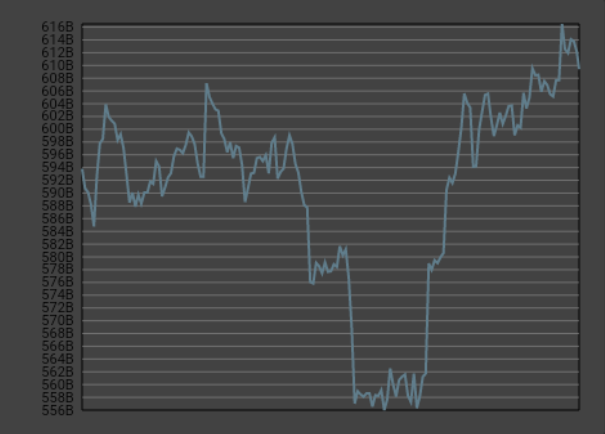
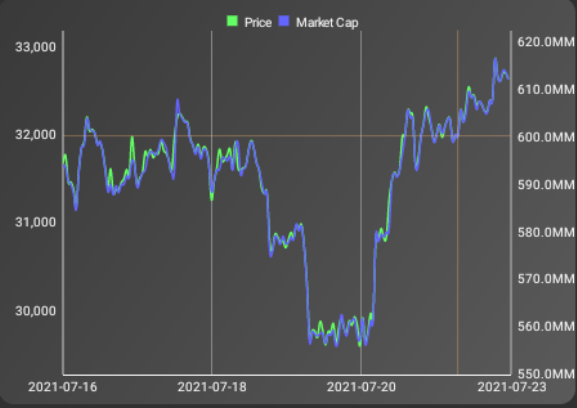
i need to compare them on one chart like this:
the problem is that the maxima and minima on the charts are very different and it turns out this:
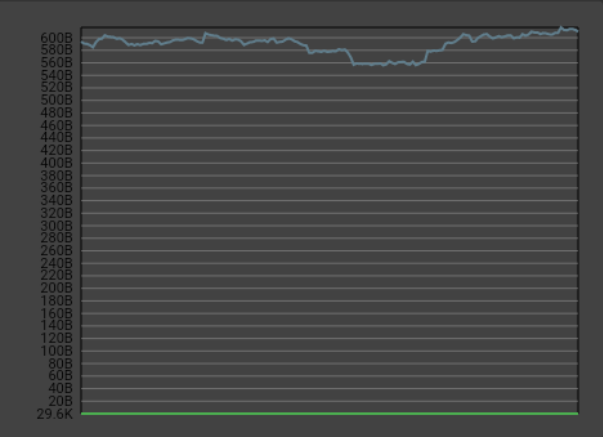
how to fix it without changing the coordinates of the charts
Flutter framework, fl_chart library
Answer the question
In order to leave comments, you need to log in
Didn't find what you were looking for?
Ask your questionAsk a Question
731 491 924 answers to any question