Answer the question
In order to leave comments, you need to log in
How to display only some points on the x-axis in matplotlib python?
I have this code:
r = [5, 6.5, 8, 7, 9, 8, 11, 15, 18, 22]
x = ["01:15:03", "01:15:13", "01:15:25", "01:16:13", "01:17:13", "01:17:58", "01:18:13", "01:19:13", "01:20:13", "01:21:13"]
plt.title('График температуры')
plt.xlabel("Время")
plt.ylabel("Температура '°C'")
plt.grid(True)
plot(x, r, '-r', mec='b')
savefig('example.png')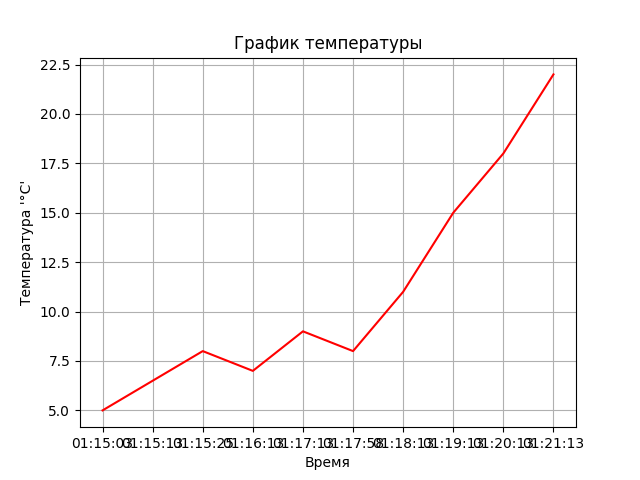
Answer the question
In order to leave comments, you need to log in
My God, 257 times already wrote the answer personally, including at this forum. Well, is it really difficult to find the answer on your own?
Explore the matplotlib.ticker module further on the MultipleLocator methods from it and the set_major_locator from matplotlib.pyplot.
Well, or you can just rotate the labels so that they don't overlap - the xticks() method parameter rotation=90.
Didn't find what you were looking for?
Ask your questionAsk a Question
731 491 924 answers to any question