Answer the question
In order to leave comments, you need to log in
How to display date along axis in matplotlib?
I recently got acquainted with the matplotlib library and faced the following problem:
I need to display the activity as a graph with a background image, so that the X-axis has a date instead of numbers, I wrote the following code:
import matplotlib.pyplot as plt

DAYS = 7
dates, messages = ["08.01","09.01","10.01","11.01","12.01","13.01","14.01"], [75,30,225,6,100,1234,567]
step = round(sum(messages)/DAYS)
steps = range(0, step*DAYS, step)
extent = [0, max(steps), 0, max(messages)]

img = plt.imread("background.jpg")
_, ax = plt.subplots()
ax.imshow(img, extent=extent)
ax.plot(dates, messages)
plt.xticks(steps)
plt.title("Активность")
plt.show()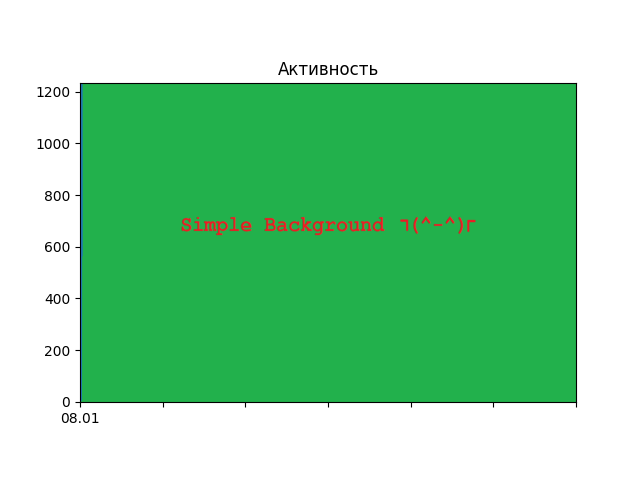
Answer the question
In order to leave comments, you need to log in
Didn't find what you were looking for?
Ask your questionAsk a Question
731 491 924 answers to any question