Answer the question
In order to leave comments, you need to log in
How to display a homemade graph in Haskell?
Good day!) I
was doing laboratory work on functional programming, it was necessary to make a database of books, newspapers and magazines. Moreover, newspapers and magazines have a month of release, while books have only a year.
I designated this custom type like this, it was already accepted, it was at this stage of study that I could not describe it better now: 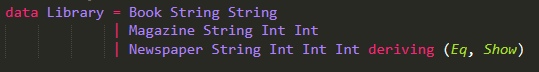
In general, the [Library] list
is given.
that is, there should be numbers from 1 to 12 and above each number there are as many dashes or minus signs (it doesn’t matter) how many printing houses (newspapers or magazines) came out that particular month.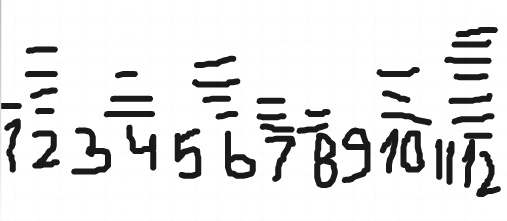
I don’t know how to do this, we haven’t met the conclusion yet, the teacher is still the same. I've been trying all day to figure it out, nothing works.
Answer the question
In order to leave comments, you need to log in
If you make the graph sideways, then the solution is trivial - to output line by line, with sticks to the right.
It will not become less informative, and the code will be greatly simplified.
If you want a horizontal histogram, you can first calculate the 12xH grid, and then transpose (turn it on its side). Further, for each cell, you can see the "fill level" and display the corresponding Unicode wand.
There is a special case of such graphs, when sticks are used with a height of 1 line, called Sparkline .
Didn't find what you were looking for?
Ask your questionAsk a Question
731 491 924 answers to any question