Answer the question
In order to leave comments, you need to log in
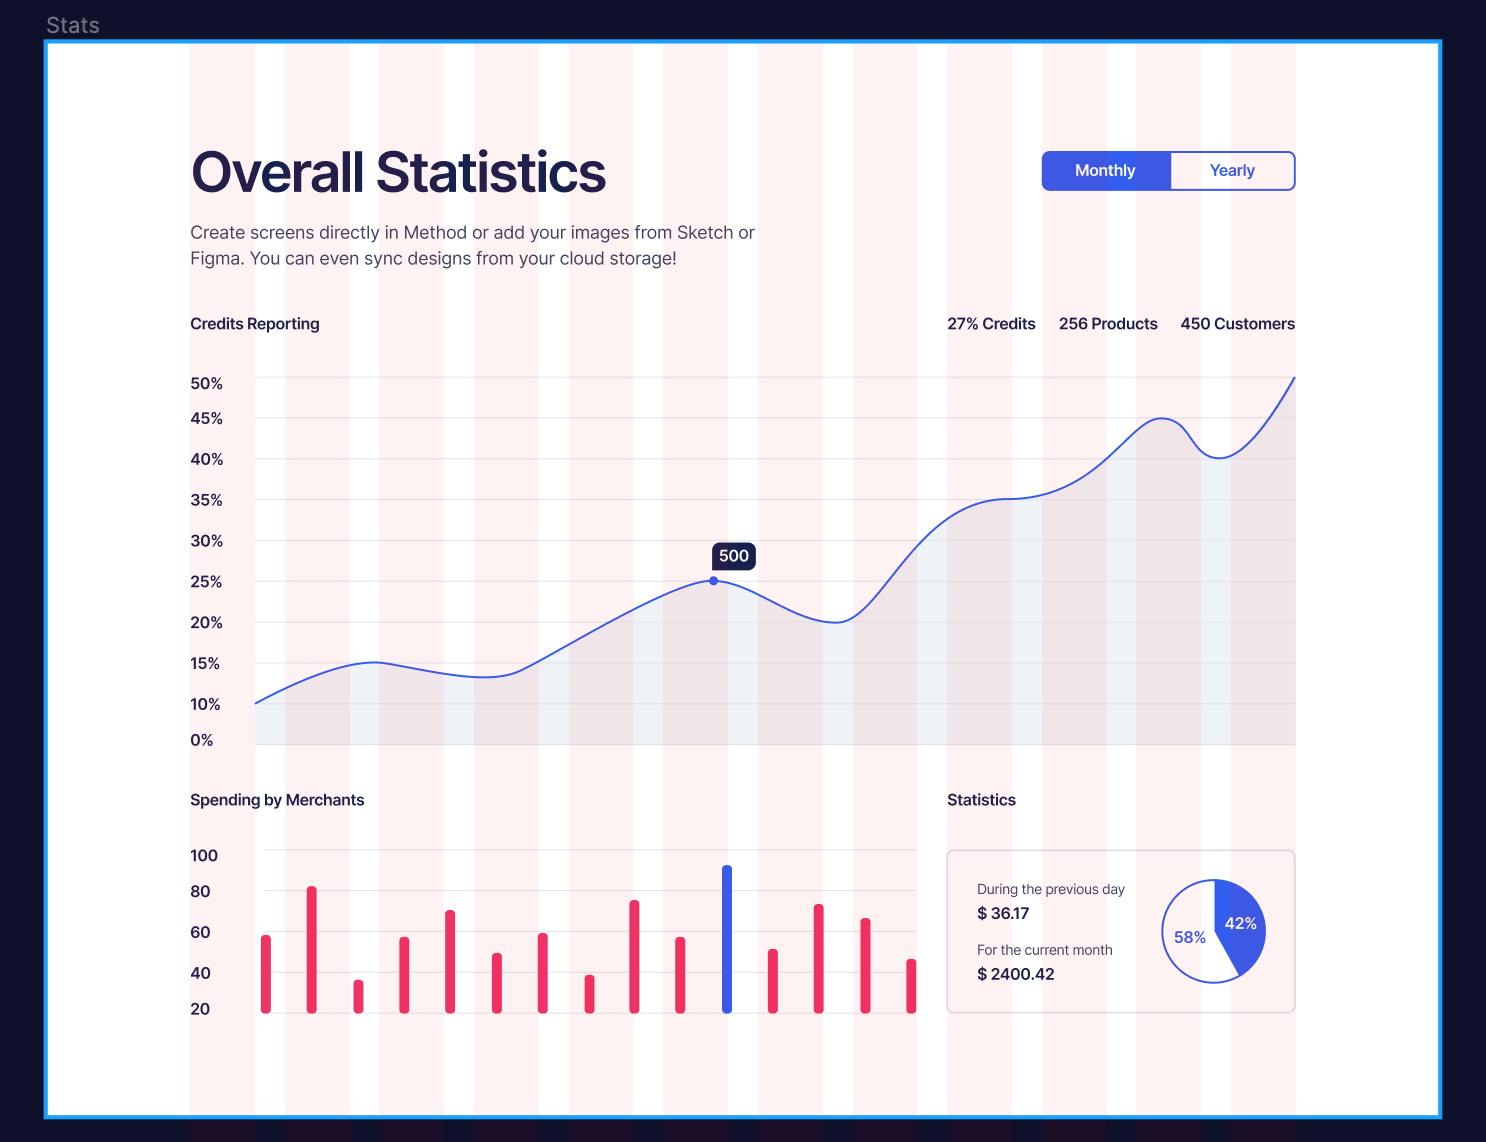
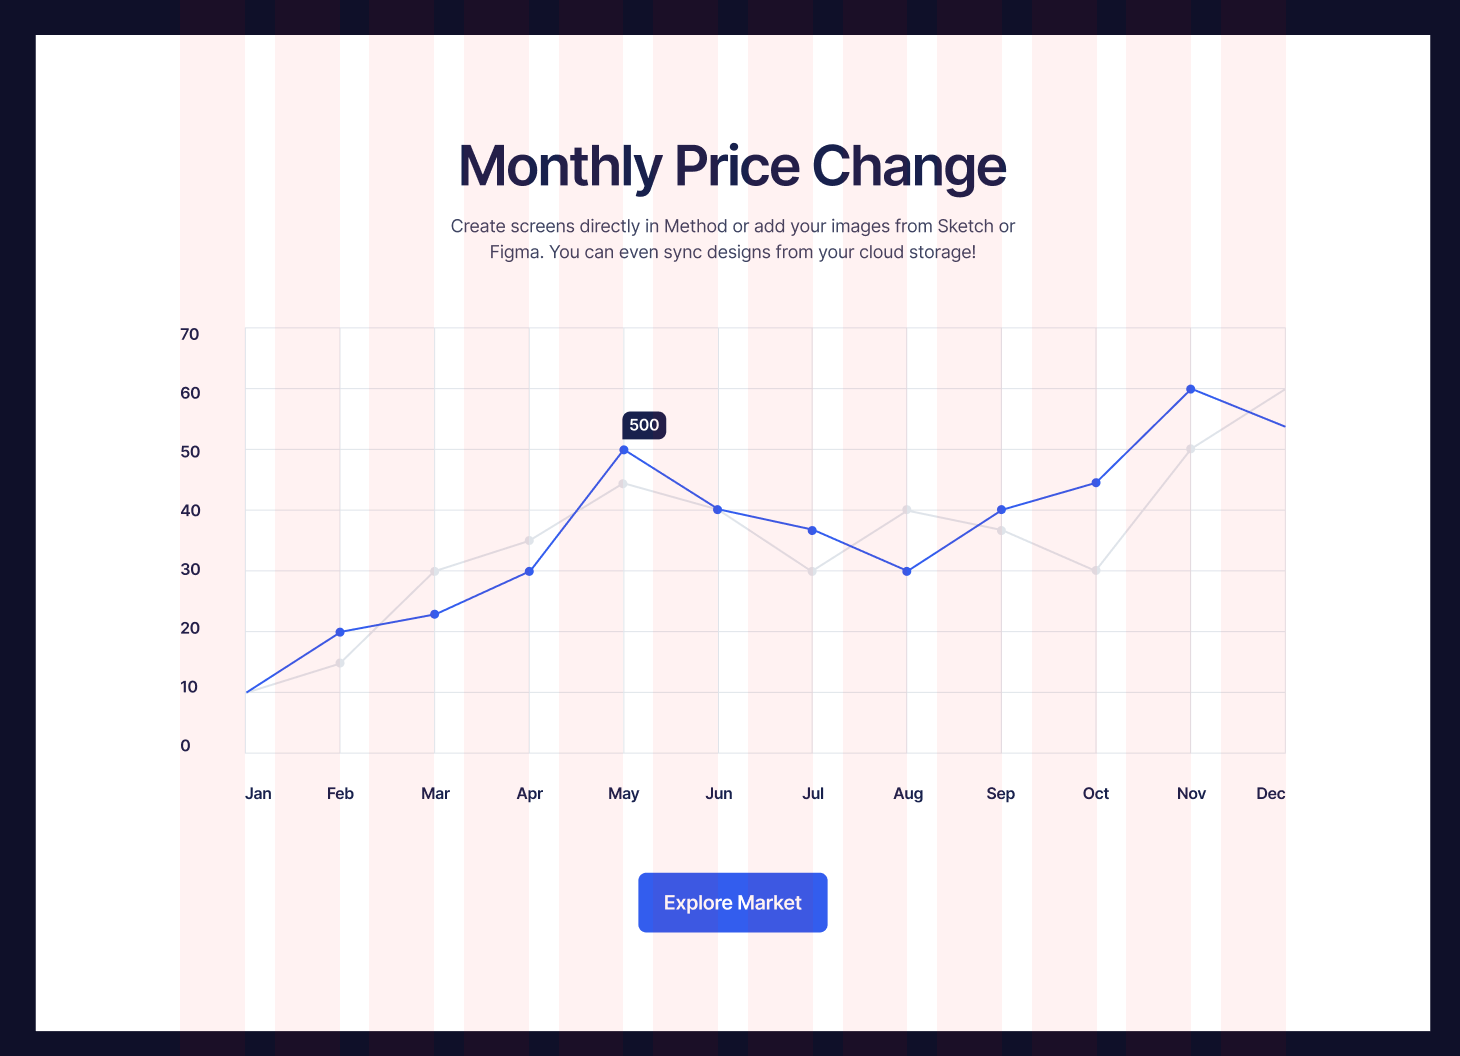
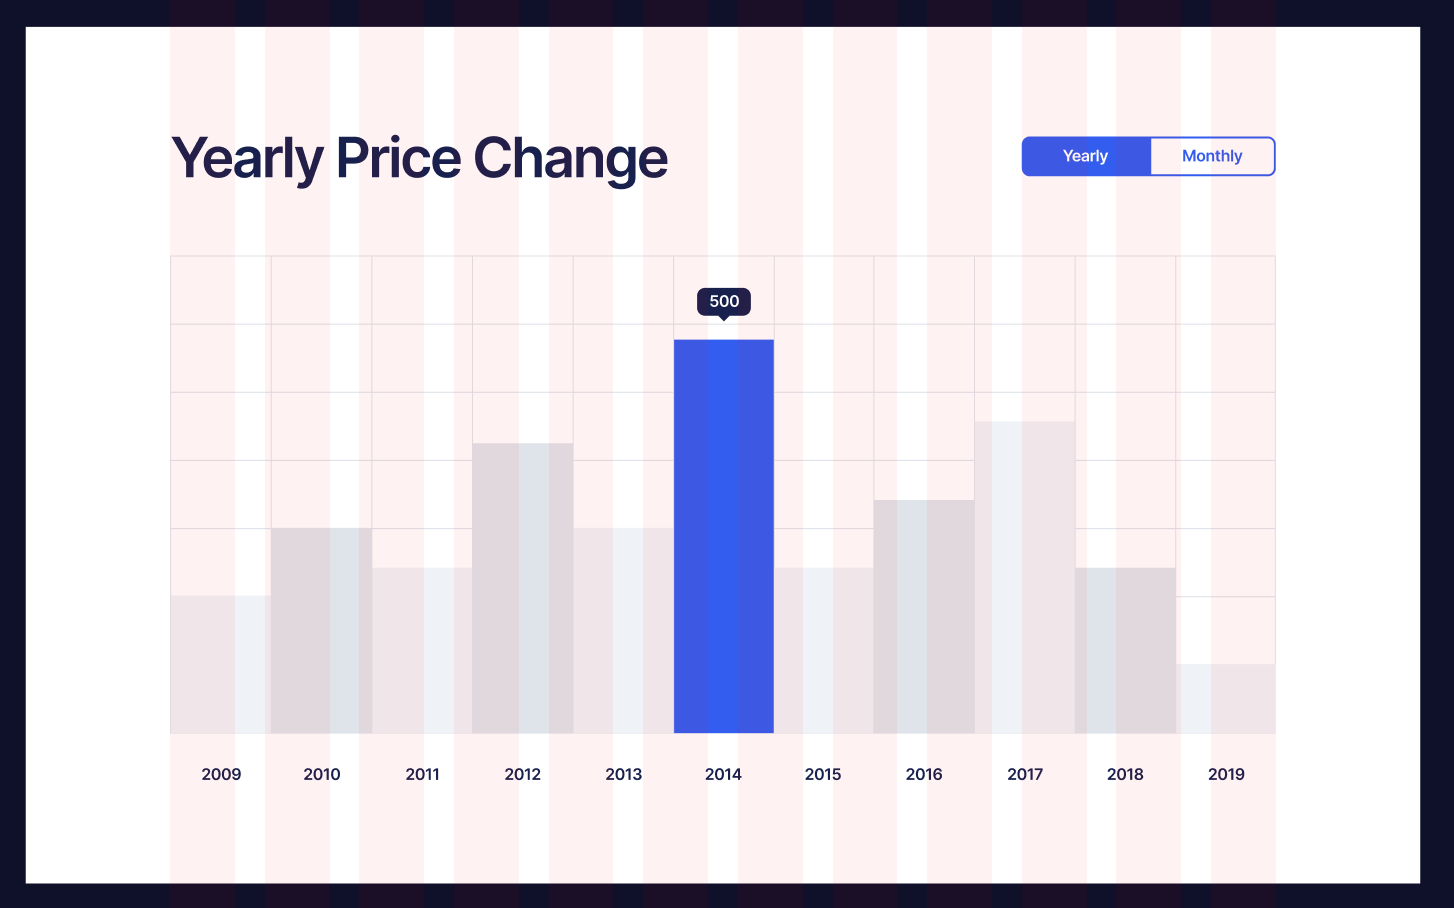
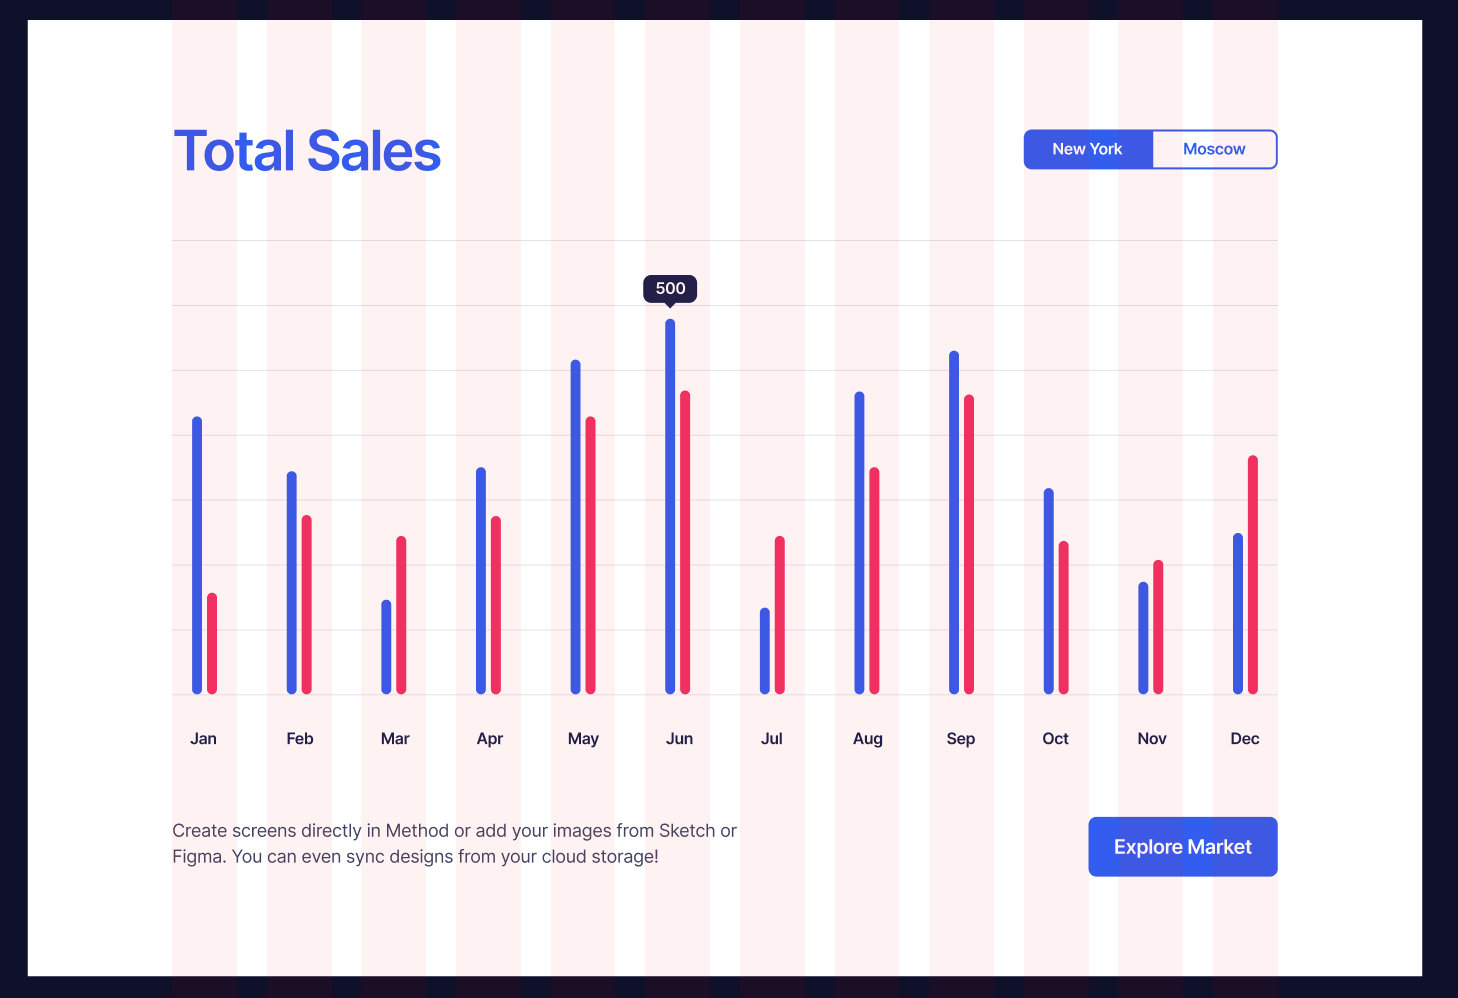
How to display a chart and indicators with statistics?
Colleagues, welcome. Based on user data, it is necessary to draw charts and indicators with statistics. Tell me, please, have you come across packages or plugins (preferably on react) that can draw statistics in the form of graphs and indicators? (screenshots are attached).
Answer the question
In order to leave comments, you need to log in
Didn't find what you were looking for?
Ask your questionAsk a Question
731 491 924 answers to any question