S
S
Shurik2021-12-13 17:21:07
xdebug
Shurik, 2021-12-13 17:21:07

How to debug php in VS Code?

Hello. I turn to you as the last resort in the hope of understanding!
I'm trying to set up a debug in vs code of a code located on a remote server. I read a bunch of articles, of documentation, videos on the pipe, but I just can’t figure out how to do it right!
So, at this stage, I have the xdebug extension installed on the server. Settings:

xdebug.mode=debug
xdebug.client_host = xx.xx.xxx.xxx
xdebug.client_port = 9003
;xdebug.start_with_request = yes
xdebug.idekey="vscode"
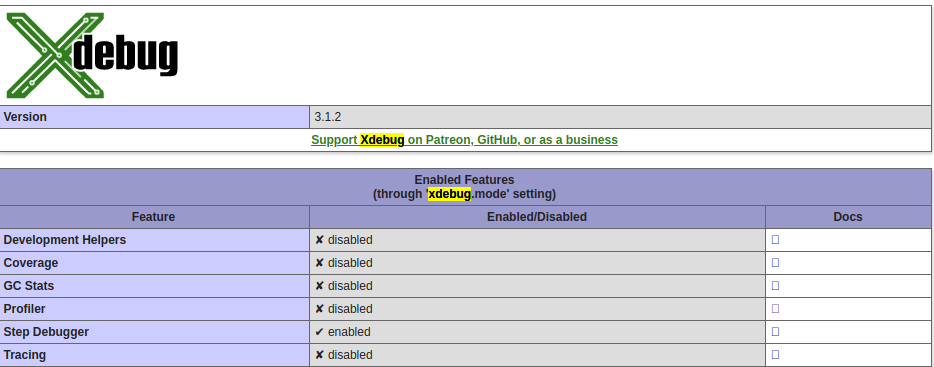
in phpinfo() it shows that xdebug is enabled and working:
61b753e1cc705562084325.png

In VS Code I installed the PHP Debug extension, and in Crome - XDebug Helper (although I still don’t understand why it is)
I also registered idekey in VSC as in the xdebug php settings.

I mount the ass from the server on my computer. I add configuration to launch.json
{
      "name": "Listen for Xdebug",
      "type": "php",
      "request": "launch",
      "port": 9003
    },


In the router, I made forwarding requests from outside the DMZ to the ip of the computer. Moreover, it should be noted that the computer on port 9003 is pinged from the server only when debugging is started in vscode.

Look like that's it. When you start debugging after setting breakpoints, nothing happens, the type debugging process hangs. Fz what's the matter.
Please explain the very mechanism of all interactions between vscode, the browser and the server, so that you can observe the variables or whatever else in the breakpoints I need.

Answer the question

In order to leave comments, you need to log in

1 answer(s)
S
Shurik, 2021-12-15
@svisch

Decided as follows. Maybe someone will come in handy.
Configuration on the xdebug 3 server (for versions earlier than 3, other parameter names):

xdebug.mode=debug
xdebug.start_with_request=yes
xdebug.client_host=<ip машины где стoит ide>
xdebug.discover_client_host = 1
xdebug.idekey = vscode
xdebug.client_port=9003
xdebug.discover_client_host = 1

If debugging occurs in the docker code, then you need to look at ip with a command like ip -a. I had 172.17.0.1. On the video that helped me, 172.19.0.1 worked. But +/- be something like this. If this is the video
Do not forget to forward requests from the router to the computer with the IDE, if it is behind the router (at least I did it). Did not check whether it will work without forwarding.
launch.json configuration
{
    "name": "Listen for Xdebug",
    "type": "php",
    "request": "launch",
    "port": 9003,
    "pathMappings": {
      "/var/www/html": "${workspaceFolder}/www"
  },

I will clarify about pathMappings. "/var/www/html" - the path on the server (or for example in the docker) where the code is located. "${workspaceFolder}/www" - the folder where it is relative to the IDE. In this case, this is the config from the docker project and www displays /var/www/html in the container. ${workspaceFolder} - as far as I understand, the project folder in VS Code. On the remote server, pathMappings was without www: "/var/www/html": "${workspaceFolder}"
After that, you need to open the file you are going to debug, switch to the "Run and debug" tab (play icon with a bug), set breakpoints in the file and click the debug button. It will start running. Next, we open on the site exactly the page for which the file being debugged is responsible and you will automatically be redirected back to VS Code and there will be debugging controls and various variables that appear in the process.

Didn't find what you were looking for?

Ask your question

Ask a Question

731 491 924 answers to any question