Answer the question
In order to leave comments, you need to log in
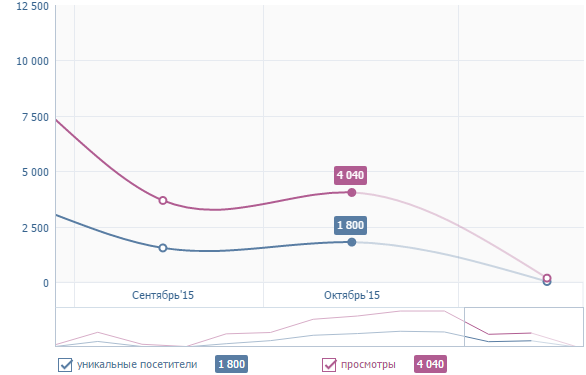
How to create a graph similar to VK visit statistics?

Namely, where to start learning canvas and what sequence algorithm is needed to create graphs?
Answer the question
In order to leave comments, you need to log in
It's easier to use ready-made libraries raphaeljs.com , flotcharts.org
You can use ready-made libraries like d3js, highchart. Not big settings + data and as a result you get beautiful, functional graphs
Didn't find what you were looking for?
Ask your questionAsk a Question
731 491 924 answers to any question