S
S
Space Around2020-02-26 20:12:08
JavaScript
Space Around, 2020-02-26 20:12:08

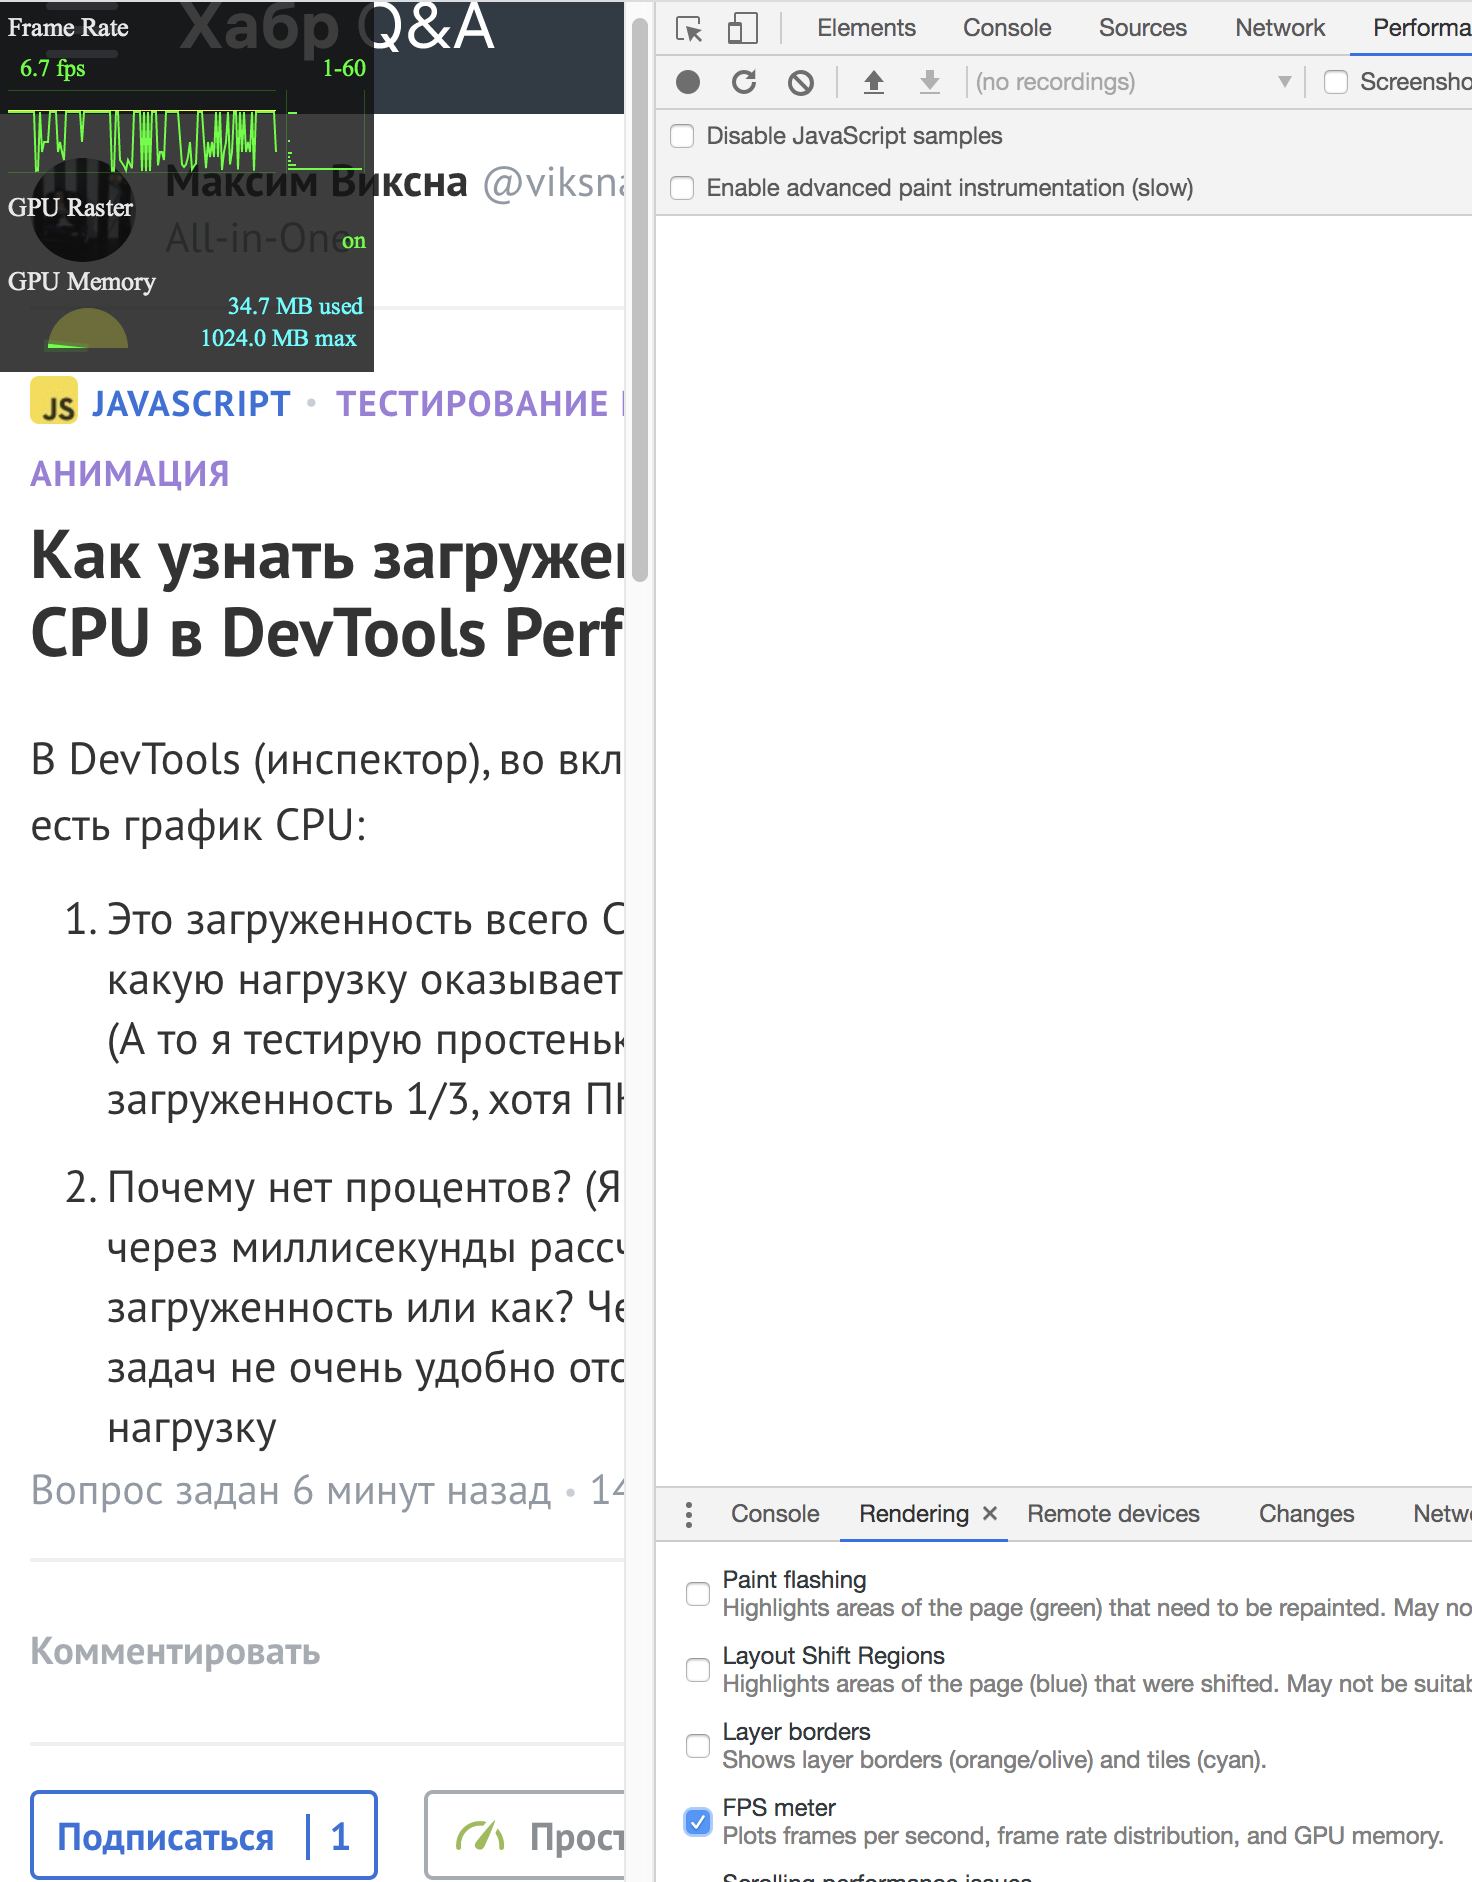
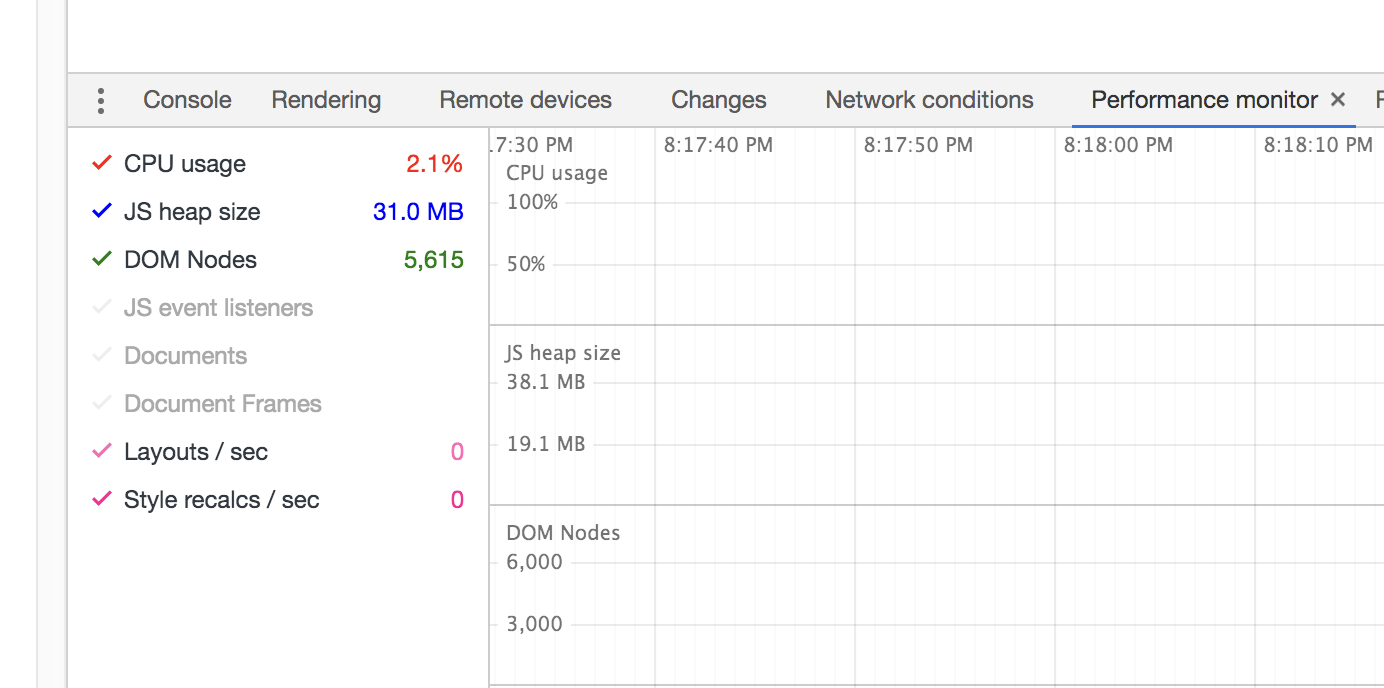
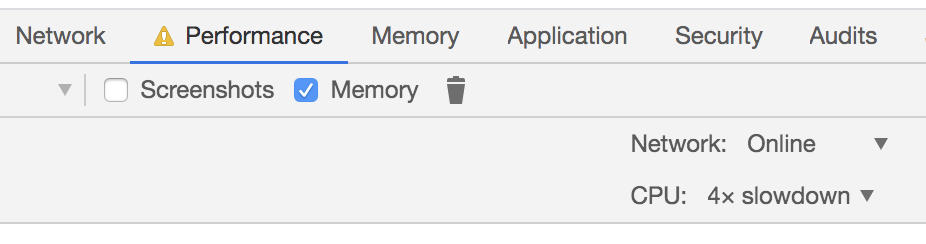
How to check CPU usage in DevTools Performance?

In DevTools (Inspector), in the Performance tab there is a CPU graph:

  1. Is it the load of the entire CPU or just what kind of load does this site have? (And then I'm testing a simple animation, and the workload is 1/3, although the PC is normal)
  2. Why no interest? (Do I have to somehow calculate the workload in milliseconds or what? It's not very convenient to track the load through the task manager

Answer the question

In order to leave comments, you need to log in

1 answer(s)
P
Pashenka, 2020-02-26
@viksnamax

Well, in the same place there is a lot of everything, and FPS will show you and the processor load and you can even artificially throttle the processor, getting a slowdown at times in order to emulate weaker devices.
5e56a8d8a198f400563318.png
5e56a8de2f43d813324248.png
5e56a8e58ef9d904840583.png

Didn't find what you were looking for?

Ask your question

Ask a Question

731 491 924 answers to any question