N
N
nurzhannogerbek2018-10-15 11:03:43
elasticsearch
nurzhannogerbek, 2018-10-15 11:03:43

How to change schedule in Kibana?

Hello comrades! Need your advice. Tell me where to dig.
There is a similar table in the PostgreSQL database. The amount of data in it is very large.

|       Stamper       |   City   | Speed |
|---------------------|----------|-------|
| 2018-09-27 02:00:00 | New York | 2.478 |
| 2018-08-27 02:00:00 | New York | 2.178 |
| 2018-07-27 02:00:00 | New York | 2.678 |
| 2018-06-27 02:00:00 |  London  | 2.878 |
| 2018-05-27 02:00:00 | New York | 3.878 |
| 2018-04-27 02:00:00 | New York | 3.478 |
| 2018-03-27 02:00:00 | New York | 3.578 |
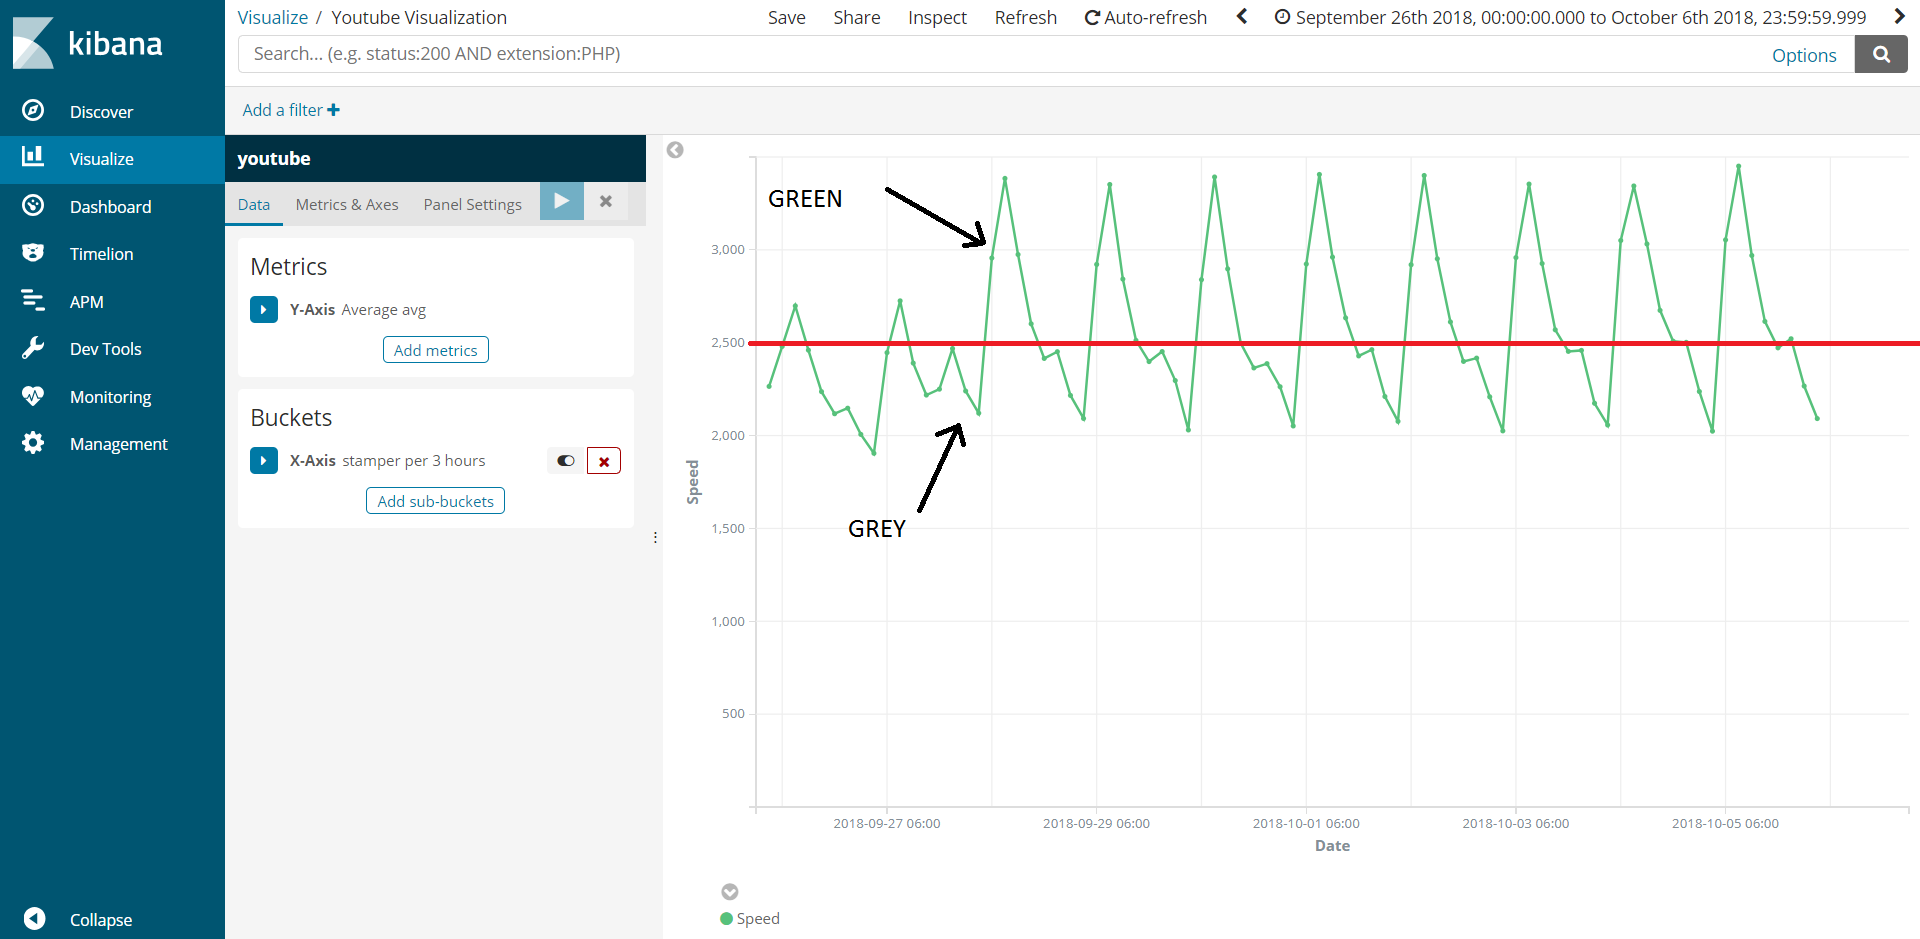
I am using Kibana (version 6.4.1) to visualize this data. You can see this in the screenshot below. The Stamper
5bc4483336d59657625450.png
column is used for the X-axis and the Speed ​​column is used for the Y-axis. I want to change a couple of things, but I can't find any information about these features in the documentation. Questions : 1. Is it possible to add a horizontal line to a widget in Kibana? In the picture above, I marked it in red. 2. If such a red line can still be added, is it possible to make its height dynamic? For example, if the city is New York, then the height is 2.5. In cases where the city is London, then the height is 3.1.

3. The third question also depends on the first. Is it possible to change the color of the graph? The part of the graph that is above the red line should be colored green. The part of the chart that is below the red line is drawn in gray.

Answer the question

In order to leave comments, you need to log in

Didn't find what you were looking for?

Ask your question

Ask a Question

731 491 924 answers to any question