Answer the question
In order to leave comments, you need to log in
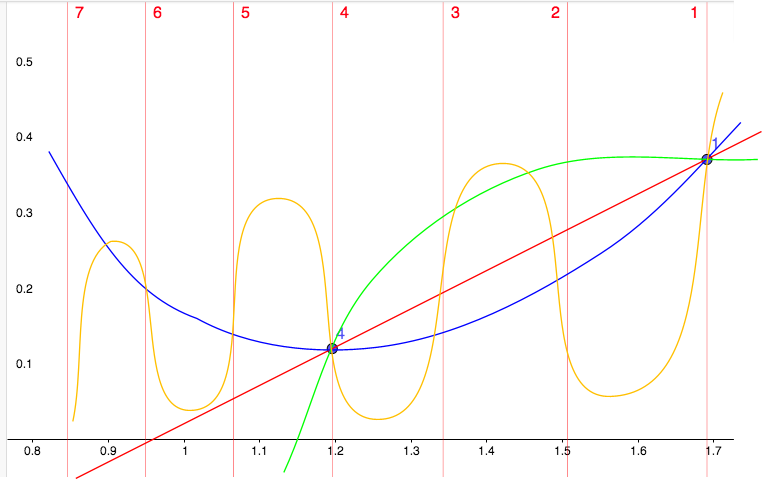
How to calculate a regression based on data that has a correlation?
I have continuous data of changing impact on an object. And the data of the reaction of the object to the impact measured at two points. I need to plot a regression line of an object's response.
When measuring the reaction at two points, it is obviously a straight line passing through them. But I want to improve the predictions using the impact data.
Example ================================================ =========
Exposure data:
1 = 169.10%
2 = 150.65%
3 = 134.22%
4 = 119.57%
5 = 106.53%
6 = 94.91%
7 = 84.55%
Reaction measurements at points 1 and 4: 0.37 and 0.12
How to calculate the reaction at other points most accurately if I know that exposure at 169.10% gives a reaction of 0.37, and exposure at 119% ~ 0 ,12 ?
The problem is that I can roughly calculate the data on the impact, and measuring the reaction is a very, very expensive operation. Literally.
UPD:
Some clarifications:
1 In fact, the measurement points, not two, but three - the third hypothetical - I know that with zero exposure, the reaction is 0.05. In general, you can subtract the baseline response and say that 0 == 0; 169 == 0.32; 119 == 0.07, X == ?
2 Of course, I tried to simply build a straight line, taking the impact as one of the axes - in principle, such a curve passes through both points of the experiment and repeats the shape of the impact curve. But for these values, it goes into the negative already at the level of about 60% of the impact, which is not all. The reaction physically cannot be negative.
Answer the question
In order to leave comments, you need to log in
This is not a question about regression, but about school mathematics.
Equation of a straight line through two given points "1" and "4". Bring to the form y = f(x)
In the resulting equation, transfer the X impact and get the forecast of the reaction Y.
Didn't find what you were looking for?
Ask your questionAsk a Question
731 491 924 answers to any question