Answer the question
In order to leave comments, you need to log in
How to build graphs in the Chart component in c++?
I work in borland C ++ builder (yes, the good old one). So, I need to build graphs of mathematical functions. I have already written a code that can read the result of an expression, for example, x * x, I can put this thing in a loop and thus get the coordinates of the points. The question is how to display all this on the screen, as far as I know the TChart component is adapted for this, but I don’t know how to use it. Can you tell me how to do this or where can I read about it?
I want the graph to look something like on picrelated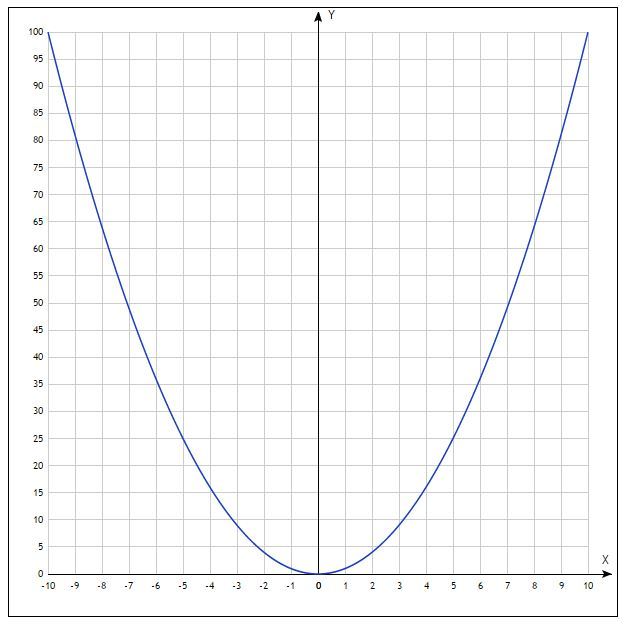
Answer the question
In order to leave comments, you need to log in
www.realcoding.net/article/view/4661
www.cyberforum.ru/cpp-builder/thread52497.html
Didn't find what you were looking for?
Ask your questionAsk a Question
731 491 924 answers to any question