Answer the question
In order to leave comments, you need to log in
How to build a smooth curve from an excess number of points?
The task arose when creating a widget that draws a graph of some data set. The widget has the ability to scale and on a scale at which it is necessary to display all the available data, there is a problem with the fact that the amount of data is tens and hundreds of times greater than the number of possible positions (pixels) along the x axis. Those. Let's say we have 10,000 values to display on a 100 pixel wide graph. To solve the problem, the average value from one "rendered segment of the graph" is now calculated, i.e. 10 000 / 100 - we get that 100 values need to be shown in one pixel. We calculate the average of these 100 values and display as the value for the given pixel.
But the challenge is to map this entire dataset into some sort of smooth spline/curve. Those. let the curve not describe the real picture of the data too accurately, but the main thing is to look beautiful. Something similar, as far as I remember, is implemented in the graphs of social attendance statistics. VK networks.
Found on the web https://en.wikipedia.org/wiki/Curve_fittingand in particular about the Gauss-Newton algorithm, but I would like, if possible, to have some relatively simple implementation, both not too demanding on resources (which does not need 100 passes to get a decent curve), and easy to implement even once not a mathematician). Maybe even if it is not a polynomial, but some function with a missing derivative at some points - the main thing is that it looks smoother than the original set.
Now, for example, the picture looks like this: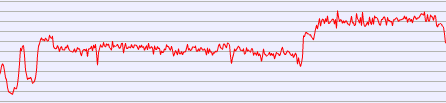
Answer the question
In order to leave comments, you need to log in
Moving median over the required number of points will save.
PS If you need to strictly keep the integral under the curve, then the moving average.
Didn't find what you were looking for?
Ask your questionAsk a Question
731 491 924 answers to any question