Answer the question
In order to leave comments, you need to log in
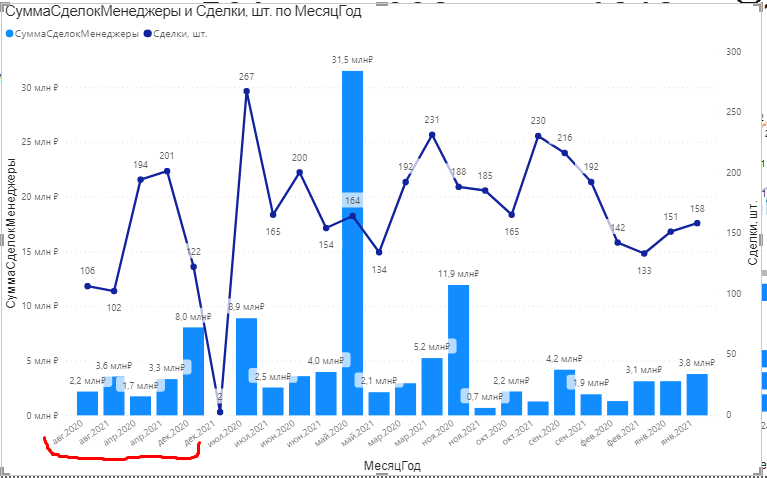
How to build a graph in power bi by months in chronological order?
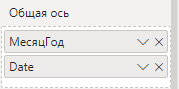
I can’t figure out how to make a graph so that the months are displayed in order, and not alphabetically. I want to see on the graph data for several years by months in chronological order. Below I apply the formula by which I made the calendar table and the screenshots of the chart in its current form, the calendar table itself and which columns I build.
Calendar =
ADDCOLUMNS (
FILTER (
CALENDARAUTO ( ),
YEAR ( [Date] ) >= 2010 &&
[Date] <= today()
),
"DateAsInteger", FORMAT ( [Date], "YYYYMMDD" ),
"Year", YEAR ( [Date] ),
"Monthnumber", FORMAT ( [Date], "MM" ),
"MonthYear", FORMAT ( [Date], "mmm/YYYY" ),
"Month", FORMAT ( [Date], "
"WeekNumber", WEEKNUM([Date],2),
"MonthNameLong", FORMAT ( [Date], "mmmm" ),
"DayOfWeekNumber", WEEKDAY ( [Date] ),
"Day", FORMAT ( [Date], "dd" ),
"DayOfWeekShort", FORMAT ( [Date], "ddd" ),
"Quarter", "Q" & FORMAT ( [Date], "Q" ),
"Month Sorter", FORMAT ( [Date], " YYYY" ) & FORMAT ( [Date], "MM" ),
"Week Sorter", FORMAT ( [Date], "YYYY" ) + WEEKNUM([Date],2)/100)
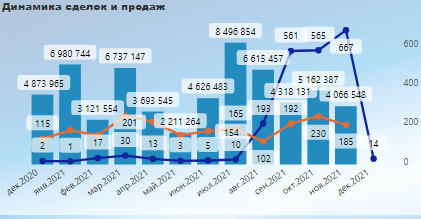
 Below is the sample graph as it should look. I searched the whole example and I can’t understand why it’s not built the same way for me. The data is the same
src=" https://habrastorage.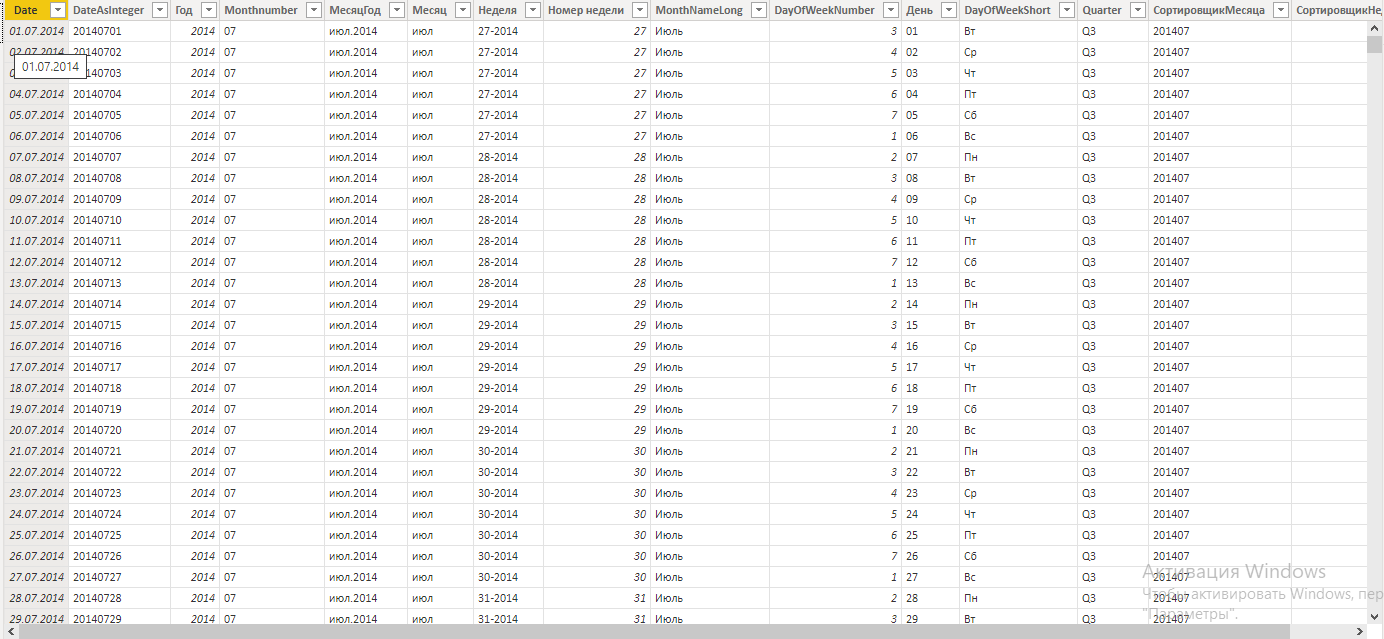
Answer the question
In order to leave comments, you need to log in
Didn't find what you were looking for?
Ask your questionAsk a Question
731 491 924 answers to any question