Answer the question
In order to leave comments, you need to log in
How to add an additional scale to the Sparkline chart?
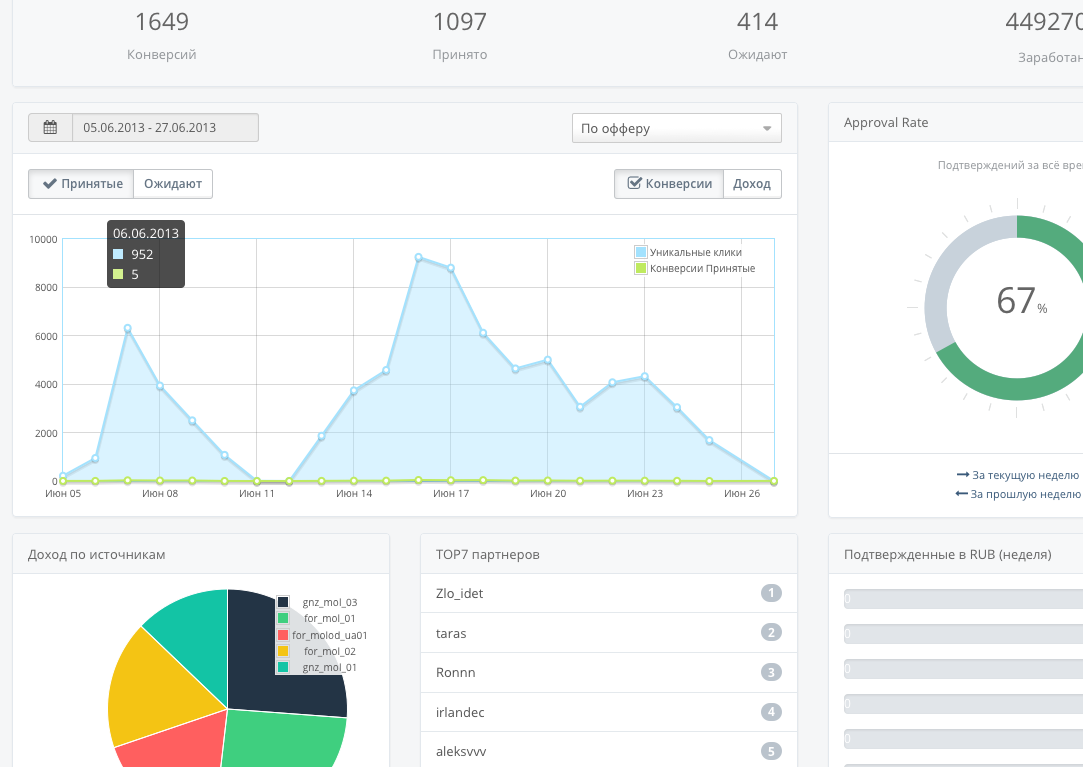
There is such a graph, sort of like Sparkline, since it is his library that is connected. 
Blue is the big numbers 100-80000
Green is the smaller numbers 0-1000
The difference is usually huge and the green line just sleeps around 0.
How to add an extra scale and attach to the green line?
Answer the question
In order to leave comments, you need to log in
Sparkline is a library for building small inline graphs.
The chart you are talking about is either highcharts or flot. This is easy to understand by looking at the html markup of the element in which the graph.
In highcharts, you can create as many axes as you want, both x and y, and link charts to different axes.
Didn't find what you were looking for?
Ask your questionAsk a Question
731 491 924 answers to any question