Answer the question
In order to leave comments, you need to log in
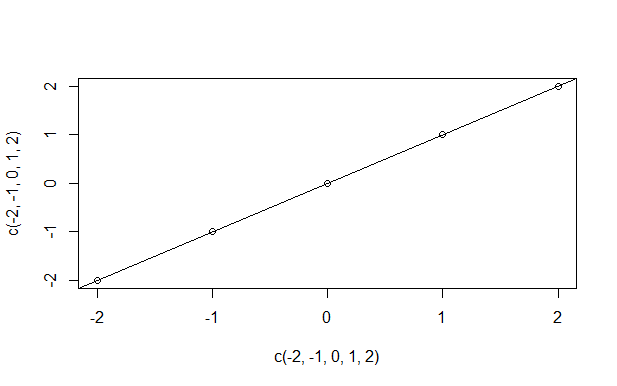
How can I add a diagonal line to my scatter plot?
To add a diagonal line to a scatter plot you can use:
1) addline(diag)
2) abline(0,1)
3) geom_line=(diag)
4) line(1,1)
And if you don't mind, could you write code that can serve as an example.
Answer the question
In order to leave comments, you need to log in
Didn't find what you were looking for?
Ask your questionAsk a Question
731 491 924 answers to any question