Answer the question
In order to leave comments, you need to log in
How can an empirical distribution function be implemented in python?
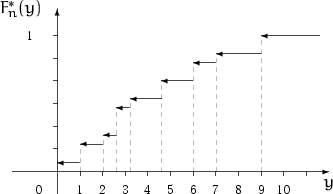
Hello, I would like to know how to implement in python the rendering of an empirical function of the form:

with a selection:
[-1.97, -0.736, -0.152, -0.049, -0.044, -0.029, 0.089, 0.306, 0.349, 0.413,
0.48, 0.518, 0.666, 0,691, 0.748, 0.834, 0.865, 0.866, 0.929, 0.974,
1.024, 1.096, 1.138, 1.197, 1.221, 1.258, 1.296, 0.426, 1.461, 1.537,
1.589, 1.679, 1.783, 1.833, 1.9, 1.922, 1.938, 1.954, 1.965, 1.976,
2.039, 2.047, 2.076, 2.261, 2.295, 2.453, 2.569, 2.604, 2.963, 3.031]
.
Answer the question
In order to leave comments, you need to log in
Let lst be your list. Then.
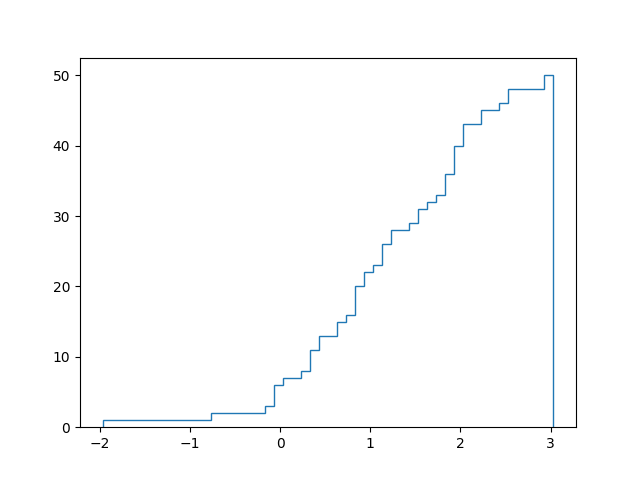
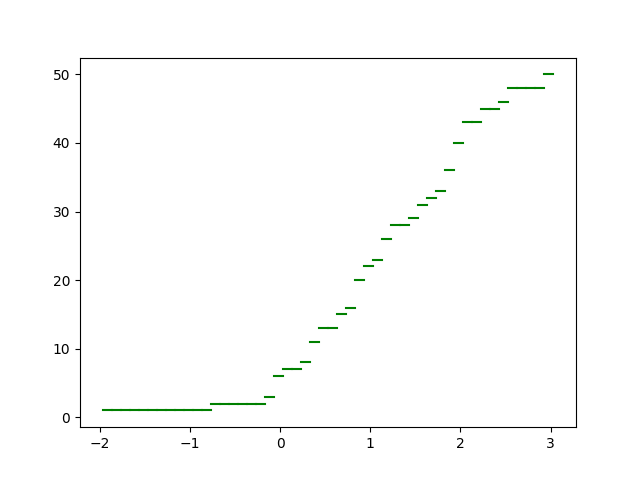
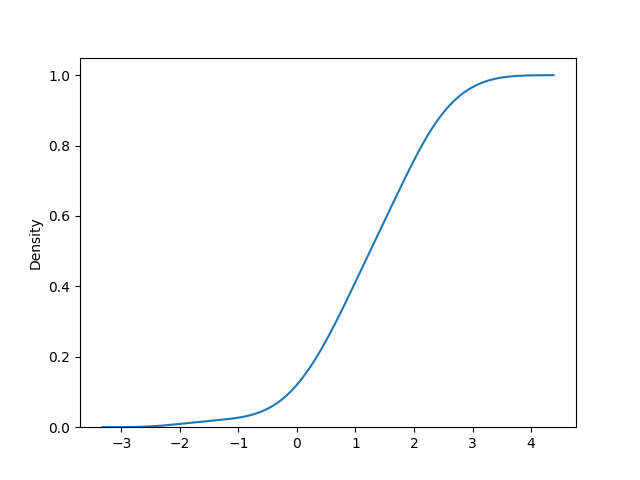
Depending on what you really need, you can do this:
plt.hist(lst, histtype='step', cumulative=True, bins=len(lst))
bin_dt, bin_gr = np.histogram(lst, bins=len(lst))
Y = bin_dt.cumsum()
for i in range(len(Y)):
    plt.plot([bin_gr[i], bin_gr[i+1]],[Y[i], Y[i]],color='green')
import seaborn as sns
sns.kdeplot(lst, cumulative=True)
Didn't find what you were looking for?
Ask your questionAsk a Question
731 491 924 answers to any question