Answer the question
In order to leave comments, you need to log in
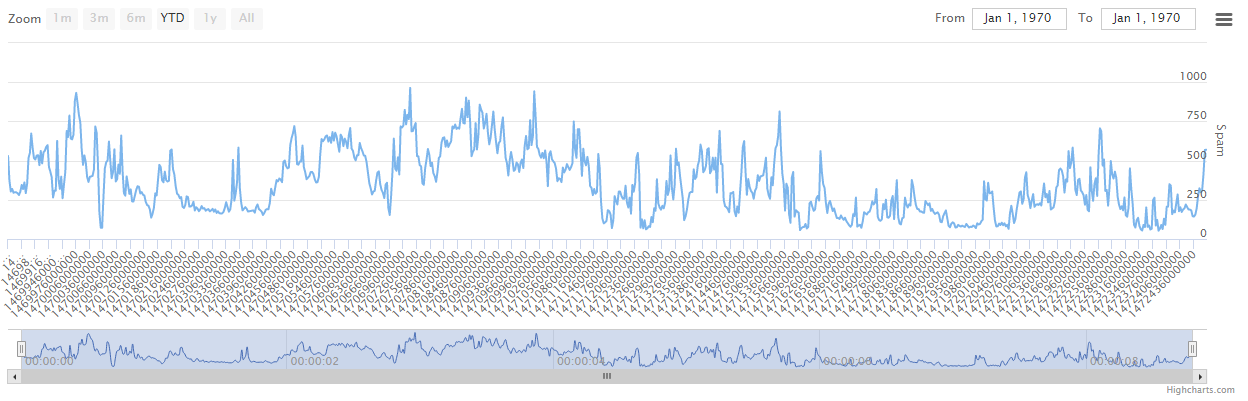
Highcharts - how to adjust the datetime axis?
Comrades! Help solve the problem. I know that the solution is trivial, but I have been trying to solve it for many days, my brain is boiling, there is no sense.
There is such a wonderful js chart builder Highcharts. I'm interested in his branch - Highstock. The task is to distribute the data on the graph over time. The data is transferred from the database and successfully entered the script. Everything is built, EXCEPT TIME. More precisely, it is displayed on the chart, but the date selection is not activated and the scale itself remains somehow incorrect. I have already translated the dates into the timestamp, ZERO.
PS If anyone knows, ideally, the time axis should be ACCOMPANYED by a graph of two X and Y axes.
My script:
$(function() {
var cats = [];
var data = [];
var Time = [];
var reverts = [];
var complaints = [];

$.get("database.json", function(resp){
  for (i=0; i<resp.length; i++) {
  numX = Number(resp[i].total);
  numY = Number(resp[i].spam);
  numx = Number(resp[i].reverts);
  numy = Number(resp[i].complaints);
  thisday = resp[i].date;
 Time = Date.parse(thisday);
 console.log(Time);
    cats.push(Time);
    data.push(numY);
    reverts.push(numx);
    complaints.push(numy);
  }
}).done(function() {

   chart.xAxis[0].setCategories(cats);
   chart.series[0].setData(data);
   chart2.xAxis[0].setCategories(reverts);
   chart2.series[0].setData(complaints);
   console.log(cats);
})

var chart = new Highcharts.StockChart({
  chart: {
    renderTo: 'container',
    marginBottom: 80
  },
 xAxis: {
   type: "datetime",
  	dateTimeLabelFormats: {
    	day: "%e. %b",
    	month: "%b '%y",
    	year: "%Y"
  },
        categories: cats

     },


     yAxis: {
        title: {
           text: 'Spam'
        }
     },
     series: [{
        name: 'Total/spam',
        data: data
     }],

   plotOptions:{
       categories:{
                turboThreshold: 120000
            },
        series:{
                turboThreshold: 120000
            }
        }
});
Answer the question
In order to leave comments, you need to log in
Didn't find what you were looking for?
Ask your questionAsk a Question
731 491 924 answers to any question