Answer the question
In order to leave comments, you need to log in
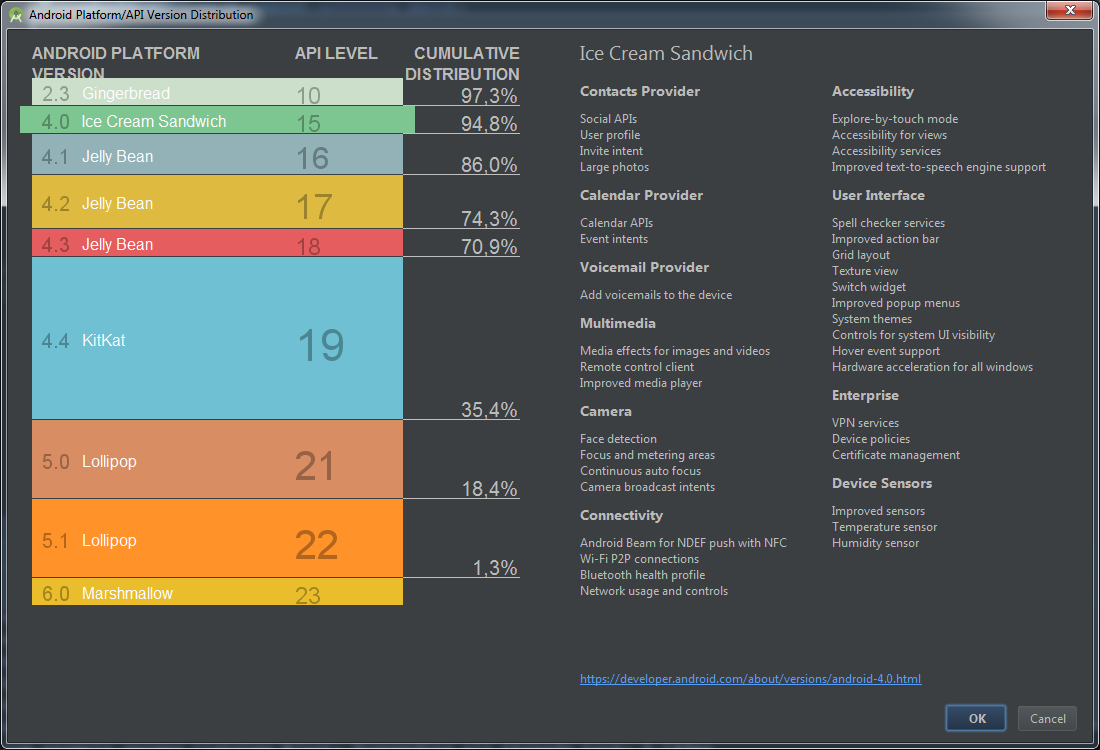
Gingerbread, Ice Cream, Jelly Bean are 90+% each!!!?
How to decipher that Gingerbread, Ice Cream, Jelly Bean occupy more than 90 percent of the total Android OS?
For example, how to estimate by "cumulative distribution" what share of all devices falls on Ice Cream? Or Jelly Bean?
Answer the question
In order to leave comments, you need to log in
This does not mean that, say, ICS is 94.8%. The table should read "ICS and all subsequent versions together gain 94.8%". If you want to estimate the volume of devices on specific versions - you are on Android Dashboards .
In general, the table you provided was compiled in order to make it easier to understand which minSdkVersion to set in the project. The distribution of devices by specific versions from this point of view will not give you anything, it is much more interesting to look at the distribution "From XYZ to the latest version".
If you look closely, the phrase Culmulative distribution will answer your question. The share of Gingerbread is 2.7%, Ice Cream is 2.5% and so on.
This is coverage. The older version you choose as the minimum version, the more devices your app will be available to.
Didn't find what you were looking for?
Ask your questionAsk a Question
731 491 924 answers to any question