Answer the question
In order to leave comments, you need to log in
Eclipse PDT / PHPStorm - how to set up full tooltips?
Help me to understand.
One of the clients updated and instead of stable updates, he also downloaded beta. On the site, all standard components have been replaced with pure D7 (new kernel) code.
This was not immediately noticed, orders on the site are active, so the option to roll back to backup did not fit.
I write on Notepad++ , from memory (hints only distract) it suits me. But then a situation arose when you urgently need to deal with the new kernel, and the documentation for it is ready for fifteen percent (IMHO), although it has been five years since it was born. Therefore, a powerful tool was needed with a “tree-like scanner” by class and hints.
Fully downloaded D7-kernel, installed Eclipse PDTand fed him. He tells everything well, but the following situation arose.
If we consider such a code, in the list of proposed
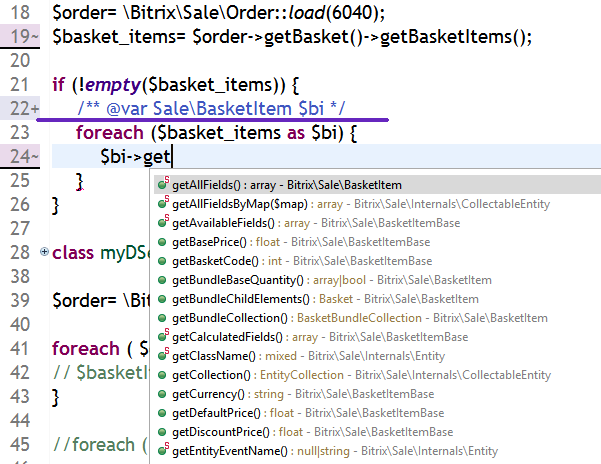
methods starting with “ get ” it gives the following list: give extended list:
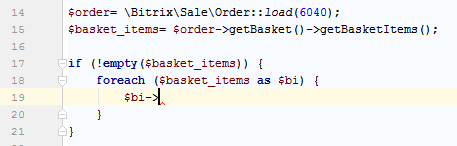
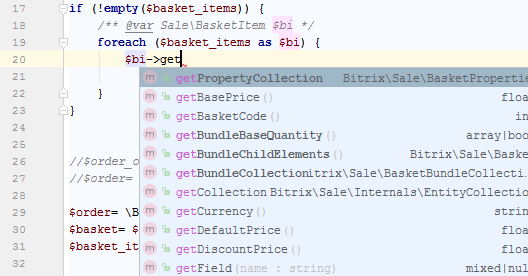
Similar to PHPStorm . By the way, the storm proved to be worse in this situation: it doesn’t give any options for the $bi variable at all (and when you type a namespace, for example “ \Bitrix\Iblock\ ”
, there are no hints, while eclipse gives out subclasses): storm picks up: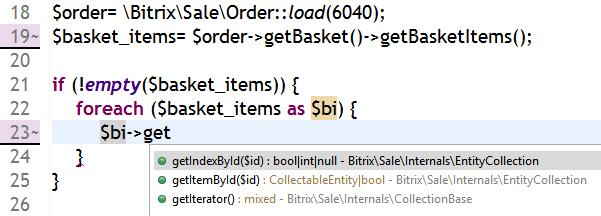
Actually the question and a few related questions:
Tell me, please, how can I understand in the process of typing code: hints contain a complete set or something else can be connected and for this you need a phpdoc insert (and understand which one) similar to the one in the example ?
• Is the situation with the storm regular, or have I not configured something and it “can do better”?
• Who is in Notepad++ : is there some kind of plug-in that allows you to feed the kernel for indexing in the same way?
PS: in the process of analyzing the situation, Visual Studio Code was also tried, but there is even more sadness.
Answer the question
In order to leave comments, you need to log in
I asked myself, I answer myself =)
I tormented technical support, but the conversation is like tennis - throwing the ball from field to field.
I set up debugging through xdebug and saw everything in the watcher.
Here's what it looks like in the debugger:
================ Remote debugging (remote debug, xdebug) ================
What you need to set up debugging remotely (because, damn it, I had to dig deeper).
Given :
Computer #1 :
Windows + PhpStorm.
Computer #2 :
Debian + Apache remotely.
Task: organize synchronous debugging between computers.
Important : storm will step through your file, and " listen " to the xdebug report it broadcasts by walking through the files on the remote server.
Therefore, the file opened in the storm must be an exact copy of what is running on the server.
In it, I disabled the xdebug.remote_enable variable , because requests from all sites on the server start pouring into the storm =) I
initialized this variable via .htaccess in the directory where I debug:
(!)within the entire site :
To make it work like this: debugging is disabled for ordinary users, and for you it starts - in htaccess we write:
<If "%{REMOTE_ADDR} == '137.126.15.14'">
  php_flag xdebug.remote_enable on
</If><If "%{REMOTE_ADDR} == '137.126.15.14' && ! %{THE_REQUEST} =~ m#/bitrix/#">
php_flag xdebug.remote_enable on
php_flag xdebug.remote_autostart on
</If><If "%{REMOTE_ADDR} == '137.126.15.14' && ! %{THE_REQUEST} =~ m#/bitrix/#">
php_flag xdebug.remote_enable on
php_flag xdebug.remote_autostart on
php_value xdebug.remote_port 9013
</If>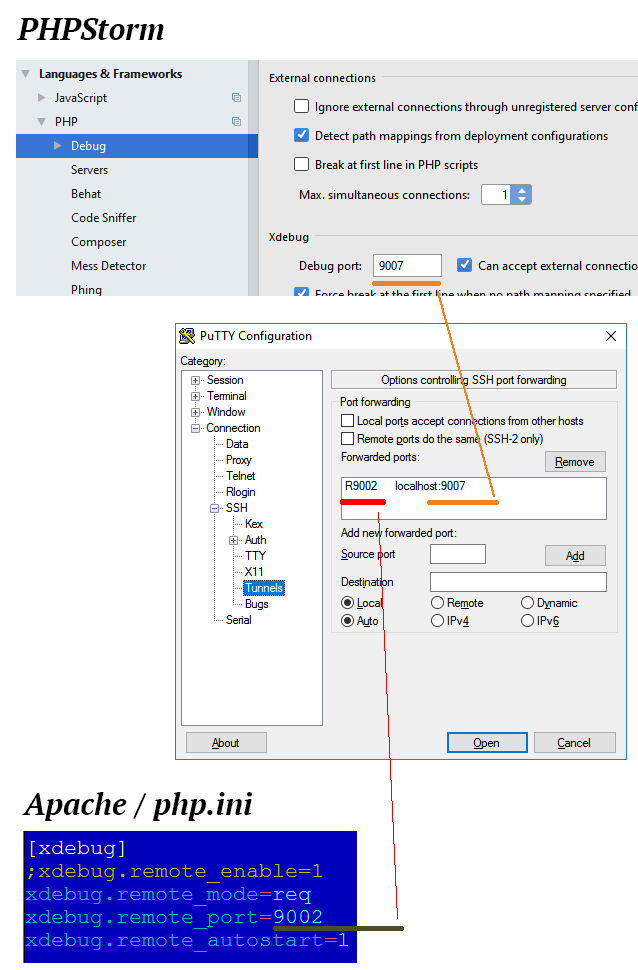 Result: when the storm listens to a port and we open a page in a normal browser that is in the section that kicks xdebug.remote_enable , the storm intercepts the signal and sends it through its debugger.
 Well, with a storm, it’s quite a regular situation. How does he know what class the object is there and whether the object is at all. Must be included in the annotation.
The variable should also be highlighted in the storm if there is a call to methods and he does not know its class.
Didn't find what you were looking for?
Ask your questionAsk a Question
731 491 924 answers to any question