Answer the question
In order to leave comments, you need to log in
Display percentage component in stacked histogram plotly?
I found this example , but it doesn’t suit me. I
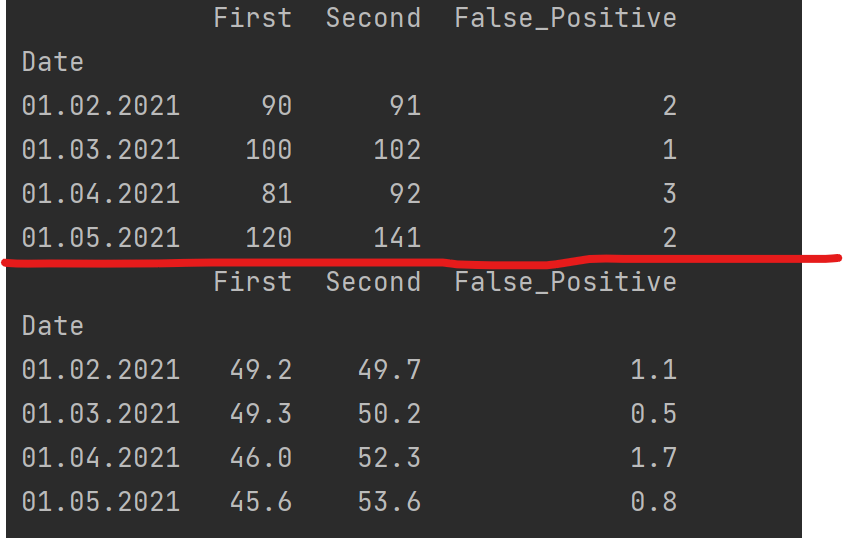
need about the same thing as in the example, the problem is that my dataset looks different:

Above is the data, after the line there are ready-made ratios . I build a
histogram like this: px.bar(df)
PS I newbie, thanks in advance to everyone who responds.
Answer the question
In order to leave comments, you need to log in
If you are a beginner - read the documentation:
https://plotly.com/python/bar-charts/
https://plotly.com/python/histograms/
Remember for the future - we go to the forum when we do something ourselves and what do we need - something specific is not clear, or it does not work. At the same time - be sure - we provide a fragment of our own code and data, according to which others can reproduce their problem, correct it or show how to solve it.
Didn't find what you were looking for?
Ask your questionAsk a Question
731 491 924 answers to any question