Answer the question
In order to leave comments, you need to log in
Diagnostic tools vs 2015?
Good afternoon!
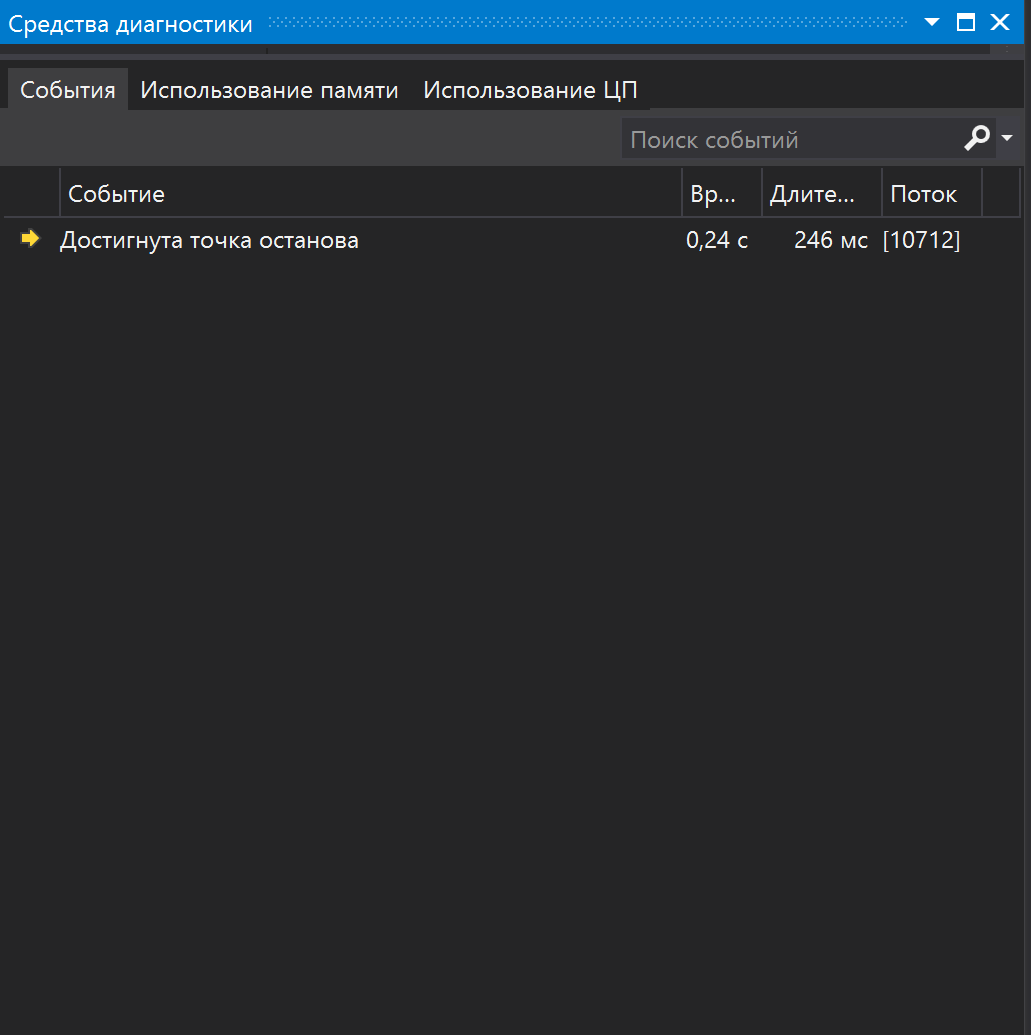
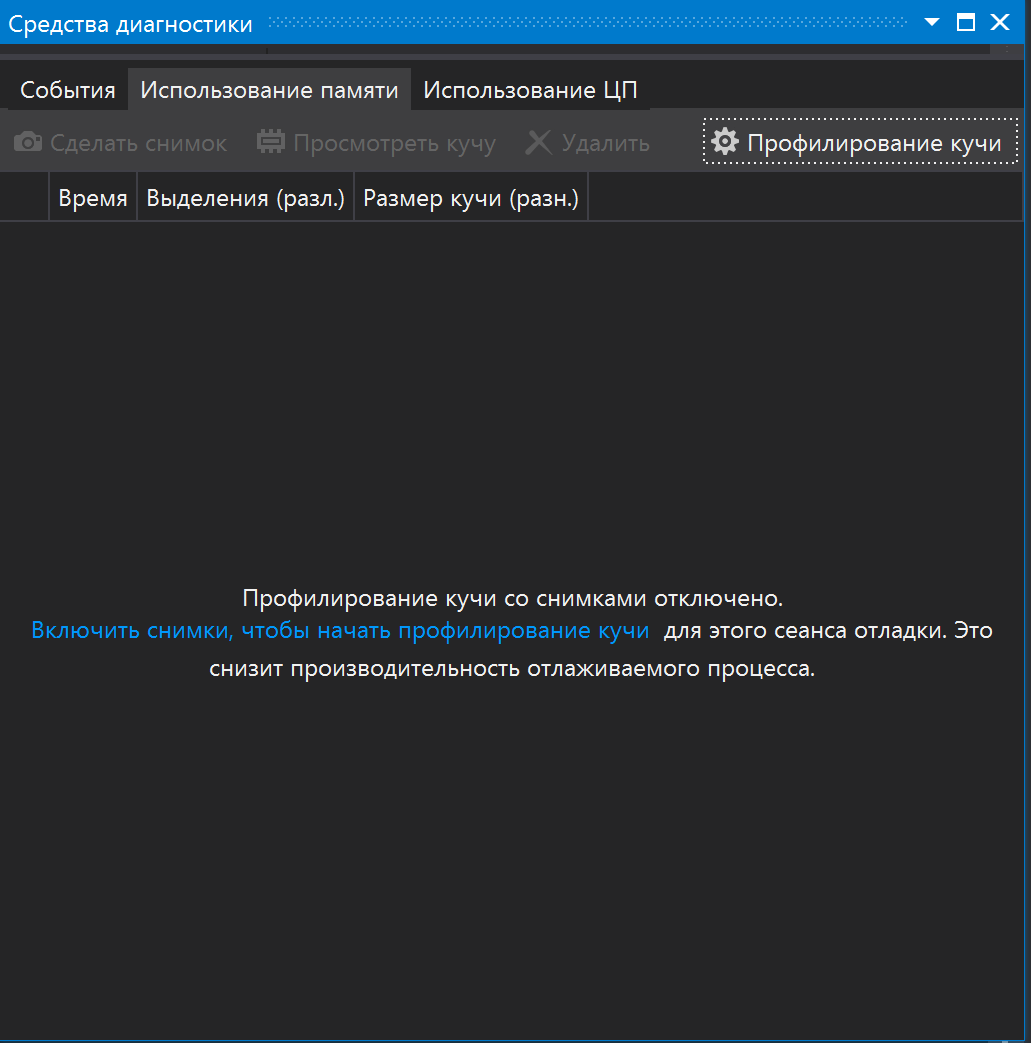
I want to see how long the program runs and how much memory it eats. I tried to use diagnostic tools for this, but if I figured it out over time, then there is no memory (
Where can I see memory resources? 

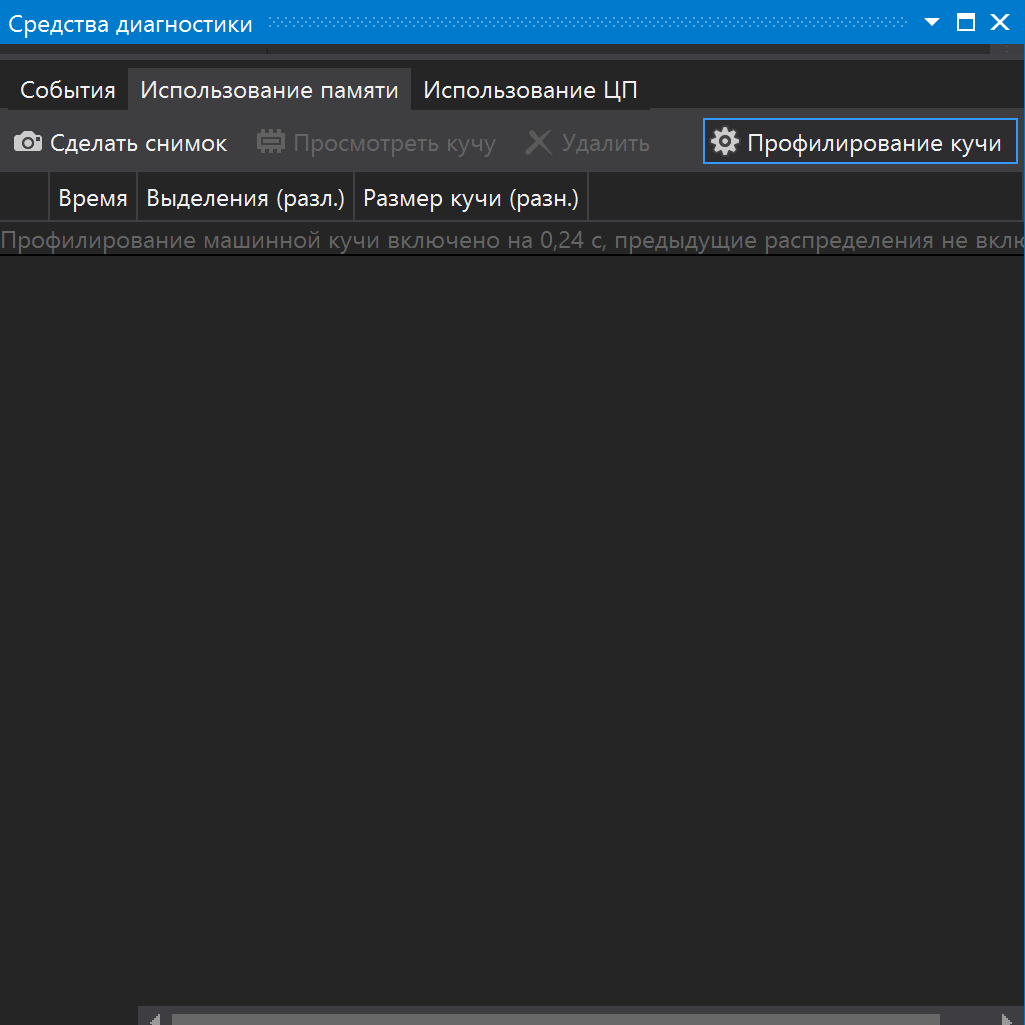
If you turn on profiling (I don’t know what it is)
Answer the question
In order to leave comments, you need to log in
Profiling is needed to find "bottlenecks" in performance and improve them
Memory consumption of the process can be viewed in the Windows Task Manager. In the Studio, as far as I know, there is no such information. It also depends on the language - in the studio you can write in many ways, starting from JS, uploading C. Each language has its own capabilities.
Didn't find what you were looking for?
Ask your questionAsk a Question
731 491 924 answers to any question