Answer the question
In order to leave comments, you need to log in
Analysis of data from temperature sensors and Fleisch tubes?
Hello.
There is such a thing in pulmonology as hyperventilation of the lungs with cold air. A person is docked to the apparatus supplying cold air through a tee with valves. When you inhale, the inlet valve opens and cold air is supplied, and when you exhale, the exhaust valve opens.
In our case, each valve has a temperature sensor (Karmanov's temperature sensors), respectively, taking the temperature of the inhaled and exhaled air. The volume of inhaled air is measured using a Fleisch flow sensor.
The data from the sensors is transferred to the program via the RTUSB3000 device. They look something like this: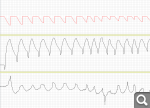
Upper graph from the Fleisch tube. Then the temperature of the inhaled air. The temperature of the exhaled air. Measurements are taken 10 times per second. On the graphs, not degrees and not liters, but millivolts, along the y-axis.
In order for the doctor to assess the quality of breathing, such parameters as the average time of inhalation, exhalation, max. min. inspiratory expiratory temperature, average max. minute ventilation.
To calculate all the parameters, it is necessary to determine the respiratory cycles on the graphs, the beginning and end of inhalation and exhalation. On the graph below, the points that need to be isolated are marked.
I would be grateful for any help, references to the mat apparatus and algorithms are welcome. 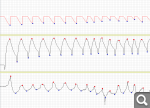
Answer the question
In order to leave comments, you need to log in
With temperatures, everything is quite simple, the graphs are without noise. You can take local minima / maxima, just sort through the entire array, counting the difference between the values at the current and at the next point, change sign, then write the point as a local extremum.
d = V[1]-V[0];
for (i = 1; i < N-1, i++) {
    d1 = V[i+1]-V[i];
    if (d < 0 && d1 > 0) {
        // Локальный минимум V[i]
    } else if (d > 0 && d1 < 0) {
        // Локальный максимум V[i]
    }
    d = d1;
}noise = 2; // Уровень шума, поставить нужное значение
t1 = 0; // Точка перехода к нулю
upDown = 0; // Направление движения до нуля, > 0 - вверх, < 0 - вниз, 0 - начало графика
d = V[1]-V[0];
if (abs(d) < noise)
d = 0;
for (i = 1; i < N-1, i++) {
d1 = V[i+1]-V[i];
if (abs(d1) < noise)
d1 = 0;
if (d < 0 && d1 > 0) {
// Локальный минимум V[i]
} else if (d > 0 && d1 > 0) {
// Локальный максимум V[i]
} else if (d != 0 && d1 == 0) {
t1 = i;
upDown = d;
} else if (d == 0 && d1 > 0 && upDown < 0) {
// Локальный минимум V[(t1+i)/2] или (V[t1]+V[i])/2
} else if (d == 0 && d1 < 0 && upDown > 0) {
// Локальный максимум V[(t1+i)/2] или (V[t1]+V[i])/2
}
d = d1;
}To filter out noise, you can use some kind of filter, for example KSmooth or a Gaussian filter , and then look for derivatives as Rsa97 said. I don’t know how it will be with accuracy, but at first glance, to determine cycles (I mean their periods), there should be quite acceptable accuracy
Didn't find what you were looking for?
Ask your questionAsk a Question
731 491 924 answers to any question