Answer the question
In order to leave comments, you need to log in
Algorithm for the distribution of points on a plane
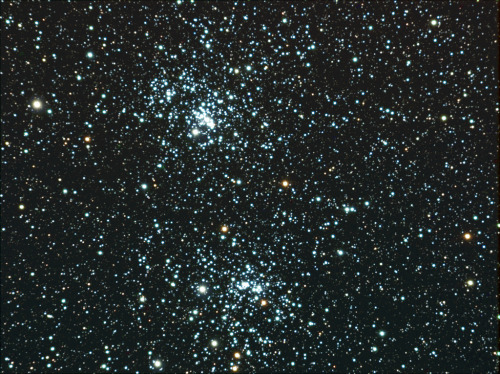
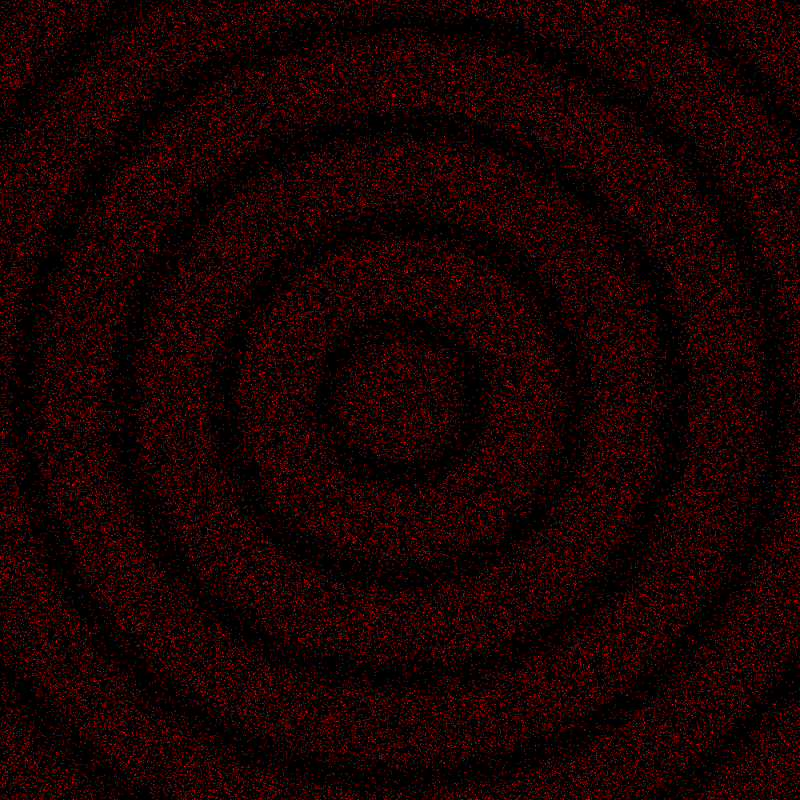
Hello. There was such a problem to implement the distribution of random points on the plane according to different rules. In particular, you need to get pictures similar to these:
1) With one center

2) With several centers

3) More complex distribution options: in the form of spirals, various curves, circles, etc.
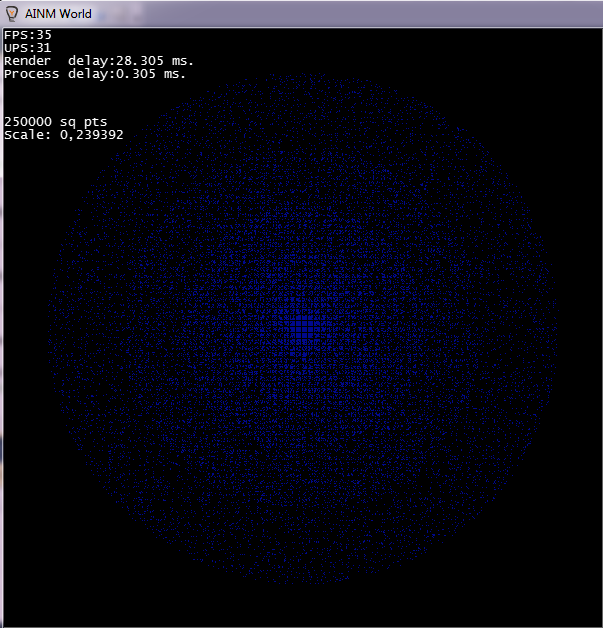
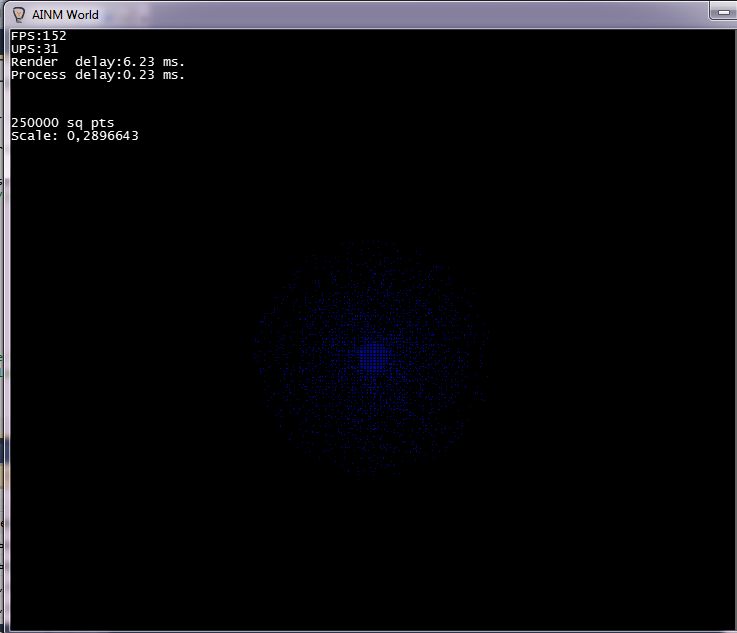
At the moment, I have implemented all this through a rather heavy algorithm for distributing probabilities over a plane. A three-dimensional function is set, the value of which along the Z axis is an indicator of the level of probability of a point falling into a given area of the plane. Thanks to this algorithm, it turns out to build pictures like this

However, this algorithm is quite heavy: for each point (and there may be hundreds of thousands) it is necessary to calculate the value of a three-dimensional function, estimate the probability level for a given coordinate, and so on.
I'm sure there are simpler and more efficient ways to solve this problem. I would be very grateful for useful links on the topic, general ideas of algorithms, as well as for pointing out shortcomings. Thank you.
Answer the question
In order to leave comments, you need to log in
Since the figures have central symmetry, it makes sense to switch to polar coordinates.
1. Sphere
for (var i:uint = 0; i < 10000; ++i)
{
       w = i;
       r = R * Math.random();

       // Преобразование в декартовые координаты
       // Задание цвета и размера точки
}
X0and Y0in Cartesian coordinates) for (var i:uint = 0; i < 10000; ++i)
{
w = i;
r = R + dR * Math.random();
// Преобразование в декартовые координаты
// Задание цвета и размера точки
}
r = r(w) + dR * Math.random();for (var i:uint = 0; i < 10000; ++i)
{
w = 0.05 * i;
r = 5 * w + dR * Math.random();
// Преобразование в декартовые координаты
// Задание цвета и размера точки
}
The first thing that came to mind: 1) We make a
bitmap
with units where we want to have the center of the cluster (you can also draw circles, spirals, etc. etc.)
pixel
3) For each pixel of the image, put a point with the probability obtained in step 2.
The first step is your input, the second step is calculated very quickly, if you do it approximately, the third step can be remarkably parallelized.
If you want to get clusters, you can apply the algorithm iteratively and randomly calculate the parameters of the "point" radius, decay rate, brightness, color, etc., etc.
For different figures there will be completely different algorithms.
I also solved this problem a couple of days ago.
the general algorithm is as follows:
1) create a two-dimensional array with zeros
2) select an arbitrary point - the basis of the circle. Choose a radius.
3) select the formula of some figure (in my case, a circle)
4) go through all the elements of the array, checking whether the current point belongs to the figure. If the point belongs to the figure, we put one with a random chance in this field of the array.
5) increase the radius
6) repeat 1-5 a couple of times.
I think it's not very successful in terms of performance, but it works.
detailed implementation (for the circle) I will throw off in PM on request.
The output is this: (very dependent on the coefficients, in a couple of minutes you can choose the right density)


What are you working on, if not a secret?
Three suitable methods are described here
.
In particular, we can take the truncation method, expanding it by one dimension:
1) choose a random point on the plane (that is, we take two random numbers xand yfrom a generator with a uniform distribution);
2) generate another number zwithin 0..1;
3) if z > f(x, y), where fis your 3D probability density distribution function — draw a point in ( x, y);
4) goto 1 (until you get bored).
This method allows you to control the "saturation" of the picture, gradually refining it. An acceptable result will be obtained faster than when iterating over all the points.
Didn't find what you were looking for?
Ask your questionAsk a Question
731 491 924 answers to any question